
Blog
Crypto research, market analysis, and practical ways to use Token Radar.

Release 26.3
This release brings Token Unlocks: an overview of upcoming unlocks, an unlock calendar, the largest cliffs, new issuance, and researched tokenomics for every token.
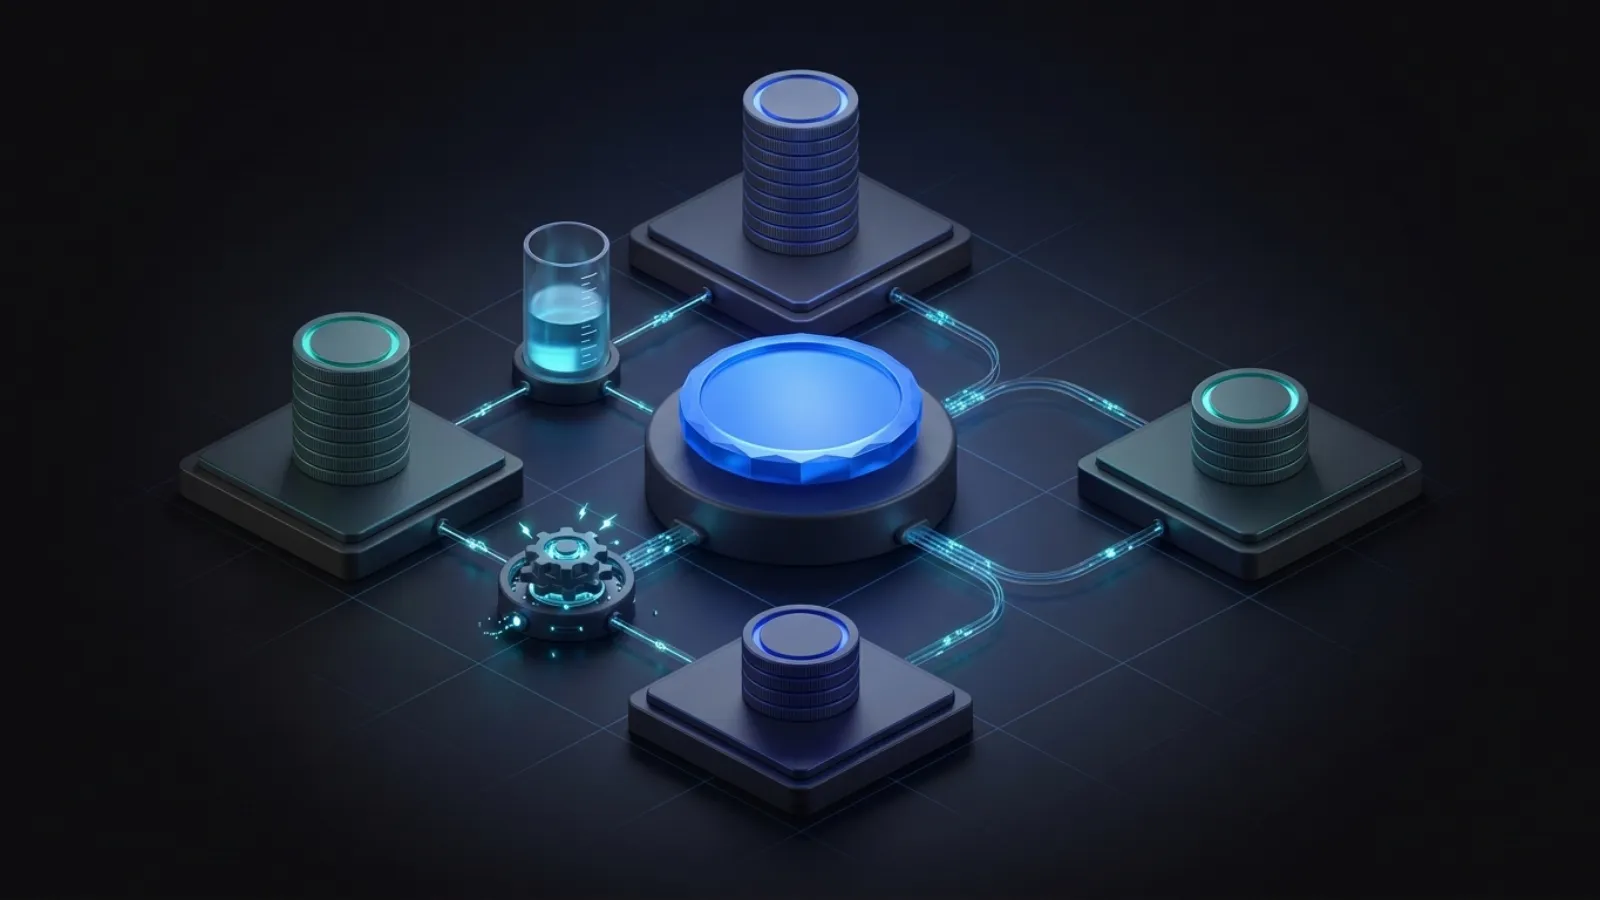
Tokenomics explained: crypto token supply, FDV, vesting and unlocks
Tokenomics explained: supply, FDV, allocations, vesting and unlocks, shown on real unlock schedules such as Arbitrum's, with Token Radar data.
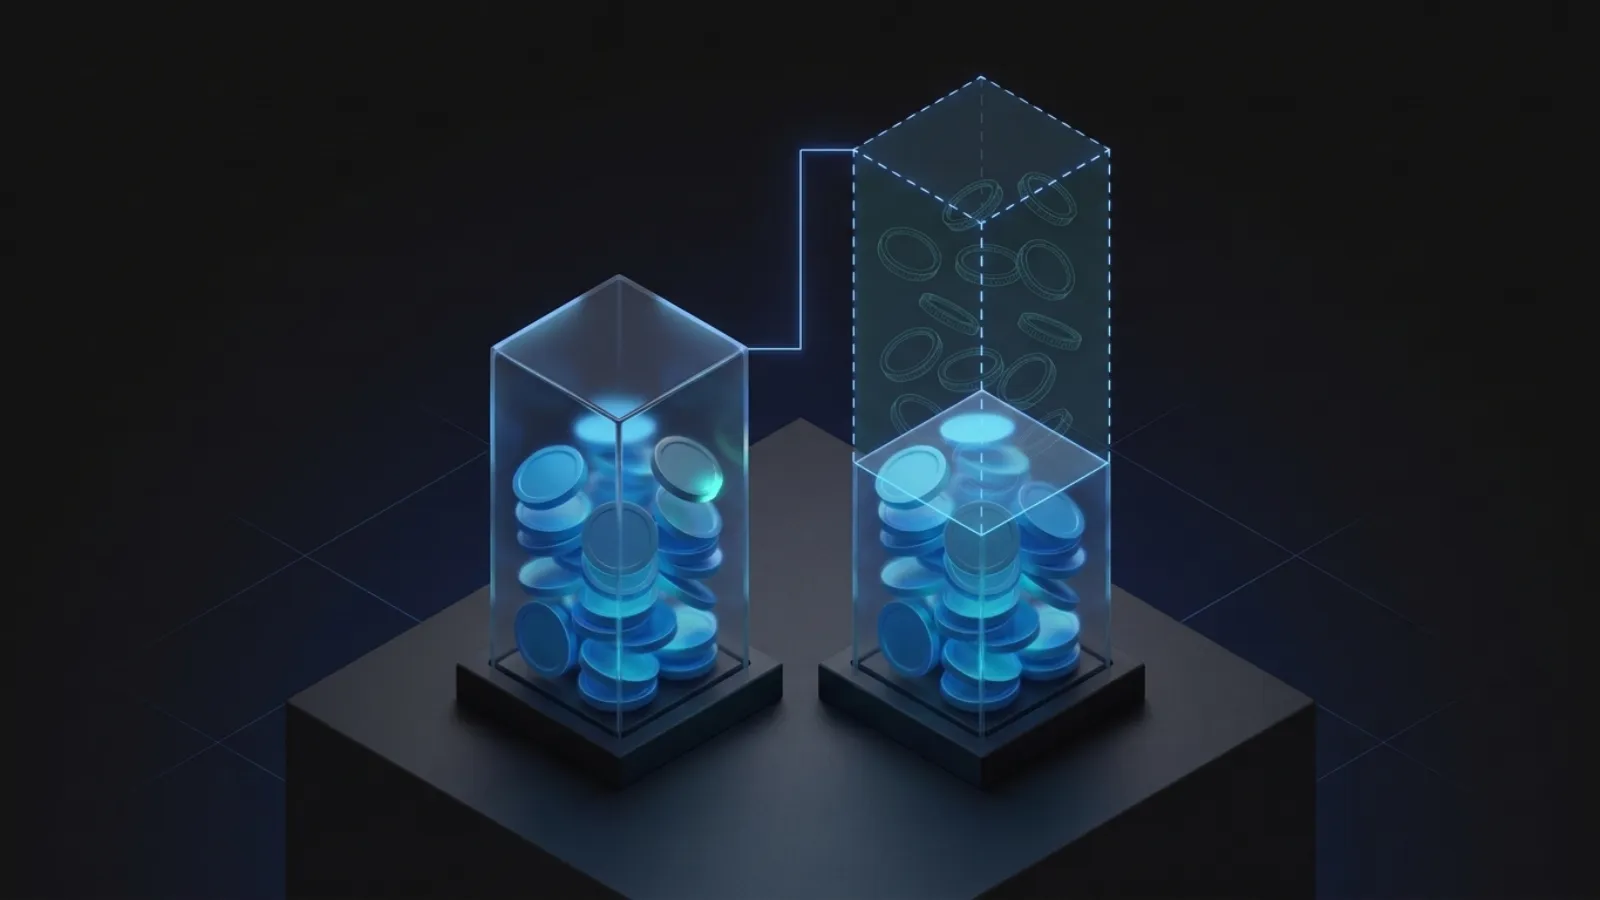
FDV Meaning: Fully Diluted Valuation vs Market Cap
FDV meaning explained: fully diluted valuation vs market cap, circulating, total and max supply, with real Market Data from Arbitrum and Worldcoin.

What is a token unlock? Cliff vs linear vesting explained
What a token unlock is, cliff vs linear vesting, and what happens on the day, shown on Arbitrum's real schedule: a one-year cliff, then monthly unlocks.
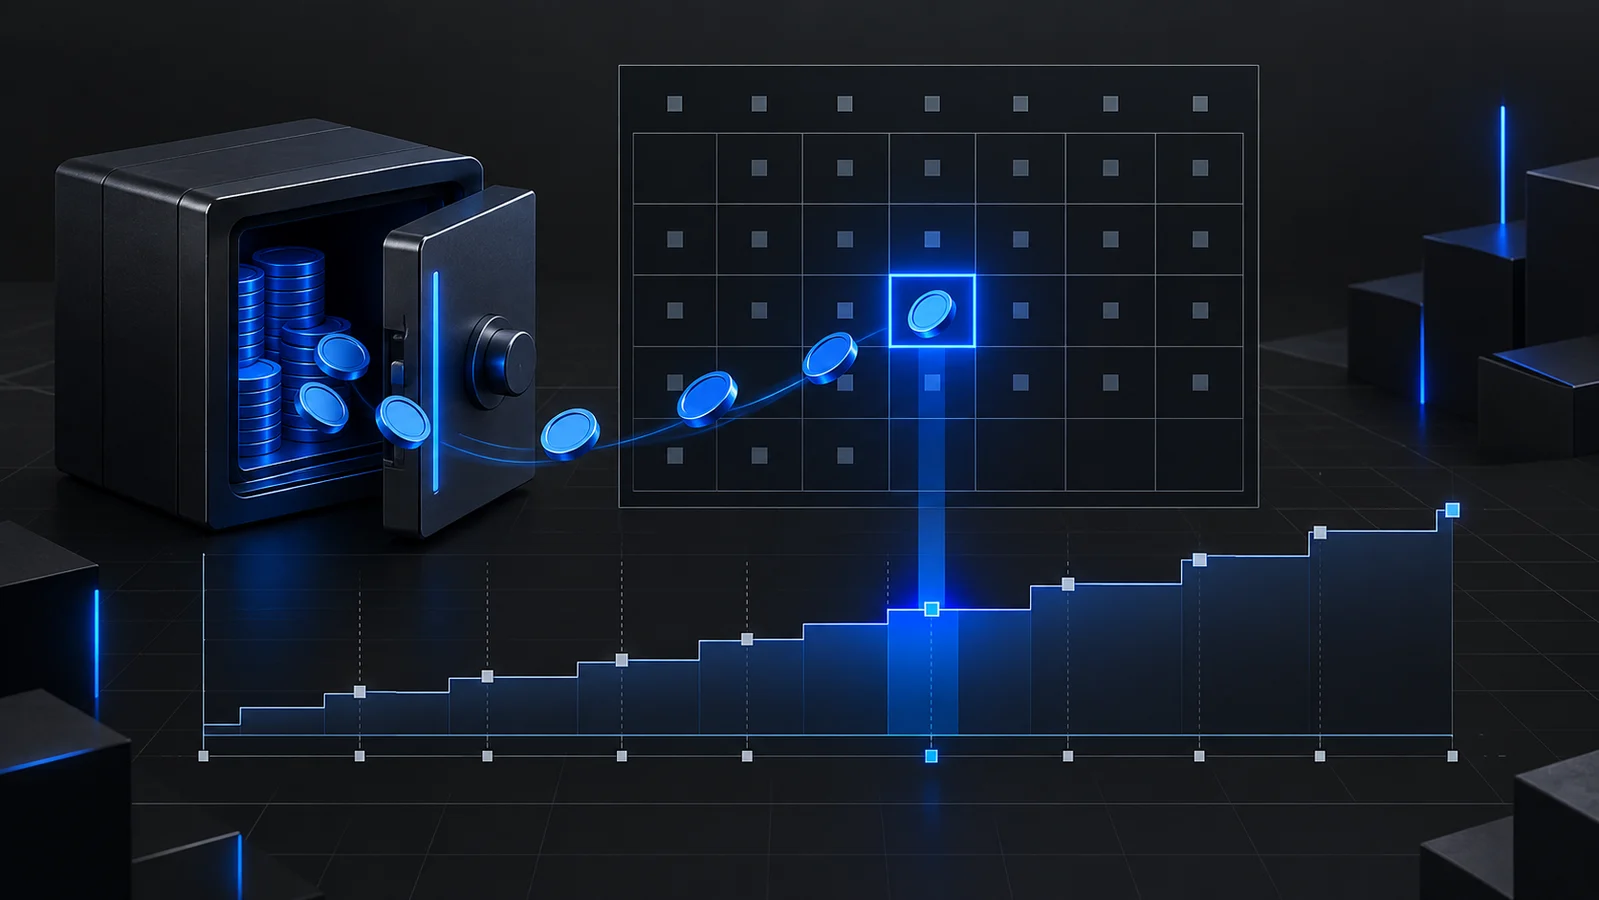
Token Unlock Schedule: Find Upcoming Unlocks
How to find a token unlock schedule: upcoming cliff and linear unlocks with USD value and share of market cap, step by step in Token Radar.

Token unlocks this month: the largest unlocks in October 2026
The biggest token unlocks of October 2026 among the top 300 tokens, ranked by value, with dates, who gets the tokens and their share of market cap.
Release 26.2
This release brings favorites lists, header bookmarks, a new deep black theme, and author pages.
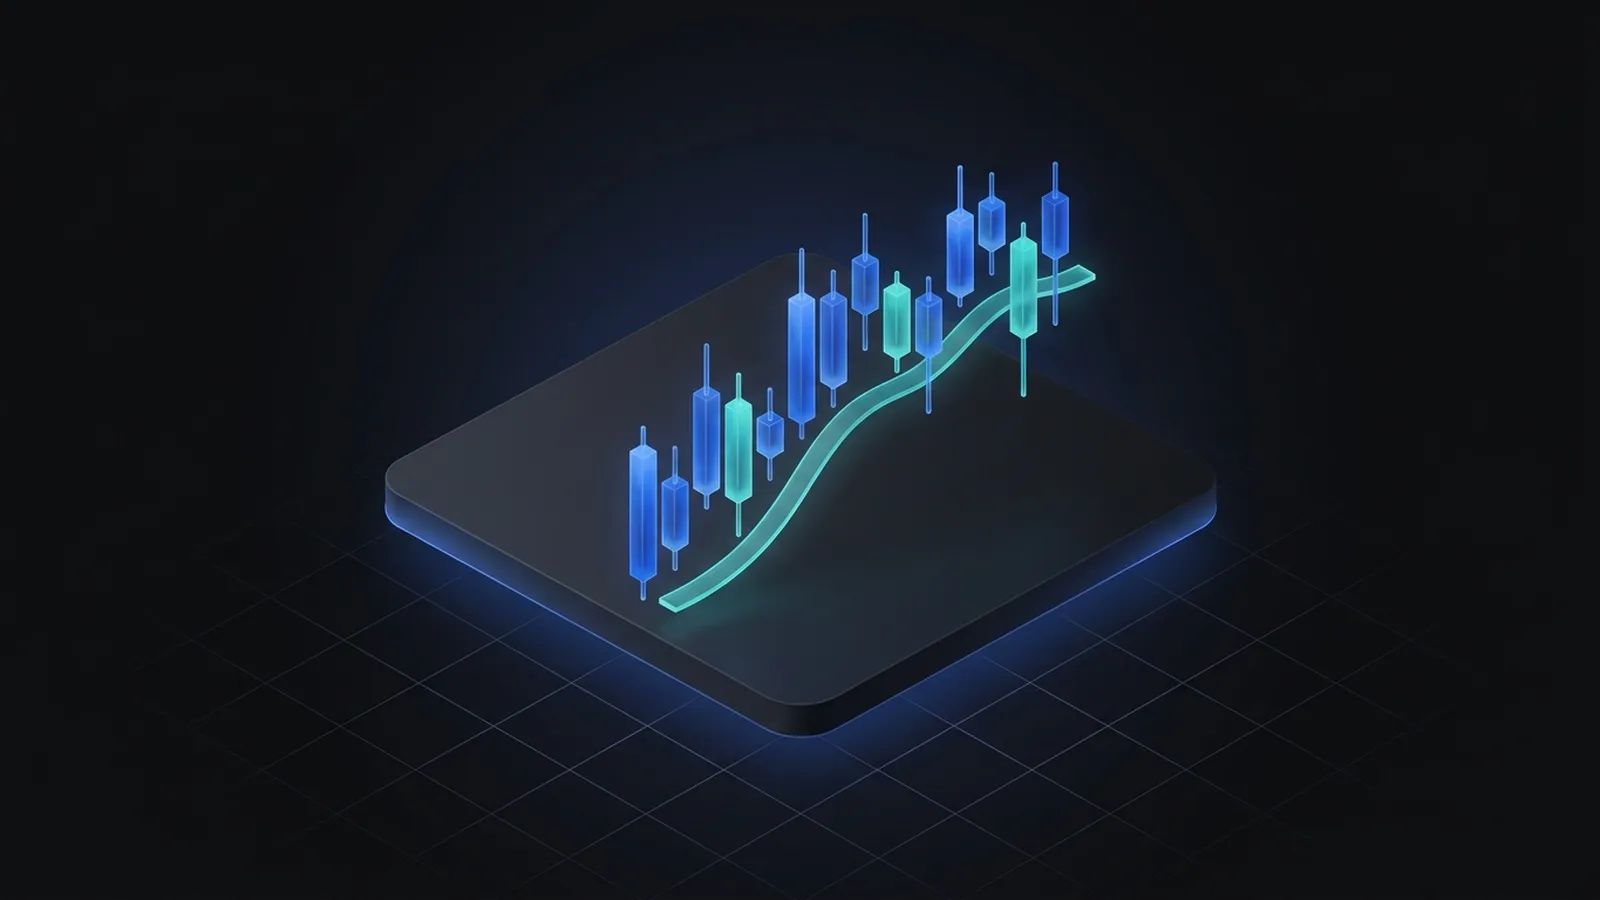
Release 26.1
This release brings candlestick charts, moving-average overlays, and more tools for researching tokens and their markets.
Release 25.6
This release introduces a weekly newsletter and significantly enhances the token detail page with richer data and insights.
Release 25.5
This milestone release brings a new login system, updated pricing, and an affiliate program.
Release 25.4
Our latest update brings enhanced social media analytics to help you track market sentiment and trends across the crypto space!

Release 25.3
Our latest update brings powerful new features to help you stay on top of market news and trends!

Release 25.2
Rebranding: We have rebranded again :-) News Mentions: We now track mentions of blockchains and sectors. Index Charts: We now show charts of all blockchains and sectors. Tokens by ABC: We've added a new alphabetical token listing.
Release 25.1
Our first release of the year is out!
Release 24.7
Our latest update is now available! This update comes with a new name and our first AI features.

Release 24.6
Our newest update is finally here! We know it took longer than usual, but we're excited to share it with you.
Release 24.5
Our latest update is now available! This update brings the new screener compare feature and lots of small UI refinements.
Release 24.4
We are excited to announce the latest update for Inuali. This release includes several new features and enhancements to improve your experience.
Release 24.3
Just in time for spring, a new Inuali release is out!

Release 24.2
Fresh off the press: our new release is ready for you!

Release 24.1
In our first release of the year, we've enhanced the mobile and tablet compatibility, ensuring optimized performance and improved responsiveness across various device sizes.
Release 23.1
Just in time for Christmas 🎄we are happy to announce the rollout of our first public release. 🥳
Looking for product help? Read the Docs.