
FDV Meaning: Fully Diluted Valuation vs Market Cap
FDV meaning explained: fully diluted valuation vs market cap, circulating, total and max supply, with real Market Data from Arbitrum and Worldcoin.
 Written by taika · Creator of Token Radar
 FDV (fully diluted valuation) is a token's price multiplied by its maximum supply: what the project would be worth at today's price if every token that will ever exist were already in circulation. Market cap is the price multiplied by the circulating supply, the tokens that can be traded today.
The gap between the two is the value, at today's price, of tokens that are still locked, unvested or not yet minted. That makes FDV vs market cap one of the first checks in any look at tokenomics. Humanity Protocol shows why it matters:
- Market cap
- $128.1M
- Humanity Protocol (H)
- Fully diluted valuation
- $602.2M
- 4.7 times the market cap
- Of the max supply circulating
- 21%
- Of the market cap scheduled to unlock in the next 30 days
- 12.3%
- Token Radar’s modeled schedule
This guide reads the gap on real tokens, shows where FDV misleads and points to where Token Radar shows the numbers.
What does FDV mean?
FDV stands for fully diluted valuation, also written as fully diluted market cap or fully diluted value. It counts every token the protocol will ever issue, including tokens reserved for the team, investors, the treasury and future emissions; market cap counts only the tokens in circulation.
| Market cap | FDV | |
|---|---|---|
| Formula | Price × circulating supply | Price × max supply |
| Supply it counts | Tokens that can be traded today | Every token that will ever exist |
| Question it answers | What is the float worth now? | What would all tokens be worth at today's price? |
| On Token Radar | Marketcap ($) on the Market Data tile | Fully Diluted Value ($), N/A without a max supply |
| Weak spot | Depends on what a source counts as circulating | Assumes every future token is worth today's price |
Arbitrum (ARB), worked through with the price of 10 October 2026, 01:00 UTC ($0.1855):
| Step | Arbitrum (ARB) |
|---|---|
| Circulating ÷ max supply | 6,785,574,605 ÷ 10,000,000,000 = 67.9% |
| FDV = price × max supply | $0.1855 × 10,000,000,000 = $1.86B |
| Market cap, as reported | $1.24B |
| Market cap ÷ FDV | $1.24B ÷ $1.86B = 67% |
The two shares are the same number in theory; the one-point gap here is timing, because the reported market cap was taken around 00:14 UTC at a price of about $0.1834. Some sources calculate FDV with total supply when a token has no fixed cap, so check which supply figure a source uses before you compare FDVs.
Circulating vs total vs max supply: what is the difference?
Three supply figures appear on almost every token page, and each answers a different question. Market cap uses the first, FDV the last.
| Supply | What it counts | Watch for |
|---|---|---|
| Circulating supply | Tokens that exist and can be traded now; the input for market cap | Locked team and investor tokens are left out, and sources differ on treasury and foundation wallets |
| Total supply | Tokens that exist now, circulating or not; usually without burned tokens | Includes locked and vesting tokens |
| Max supply | The most tokens that can ever exist under the protocol's rules; the input for FDV | Some tokens have none, because new tokens are issued indefinitely |
Bitcoin is the near-full case: 20,095,865 of its 21,000,000 BTC circulate, 95.7%, and issuance stops "with a total of 21 million bitcoins in existence" (Bitcoin FAQ). Its FDV of $1.73T is only 1.05 times its $1.66T market cap. Data as of 10 October 2026, 01:00 UTC, source: Token Radar.
For a token with a hard cap and everything already minted, total supply equals max supply and only circulating supply is lower. For a token that still mints through staking or mining rewards, all three differ; how tokens move from locked to circulating is covered in our explainer on token unlocks.
What does the market cap to FDV ratio tell you?
Market cap divided by FDV equals circulating supply divided by max supply, because the price cancels out. The ratio is the share of all tokens already on the market: a supply measure, not a sign that a token is cheap or expensive.
| Token | Market cap | FDV |
|---|---|---|
| Arbitrum (ARB) | $1.24B | $1.86B |
| Worldcoin (WLD) | $1.93B | $5.09B |
| Humanity Protocol (H) | $128.1M | $602.2M |
Worldcoin (WLD) is the middle case: $1.93B ÷ $5.09B = 38%, so 62% of its eventual supply, about 6.2 billion WLD, still has to arrive through unlocks, vesting or emissions. Data as of 10 October 2026, 01:00 UTC, source: Token Radar.
What is a good FDV ratio?
There is no universal threshold. As a reading aid, Token Radar labels the circulating share of max supply in three bands:
| Label | Circulating share of max supply | Example | FDV vs market cap |
|---|---|---|---|
| LOW | Below 33% | Humanity Protocol (H), 21% | |
| MEDIUM | 33% to under 67% | Worldcoin (WLD), 38% | |
| HIGH | 67% and above | Arbitrum (ARB), 68% |
Token Radar also tags a token LowFloat-HighFDV when no more than 20% of its max supply circulates and its FDV is $500 million or more. Neither label is a verdict: young tokens usually start with a small float, and what matters next is when the rest arrives and who receives it. Data as of 10 October 2026, 01:00 UTC, source: Token Radar.
Why does a high FDV mean unlock overhang?
A large gap between FDV and market cap is called unlock overhang: supply scheduled to reach the market later. The ratio says how much is still to come, not when it arrives or who gets it, so two tokens with the same ratio can face very different years.
Real schedules show the same spread. Over the next 30 days, Token Radar's modeled schedules release these amounts:
| Token | Circulating share | Scheduled, 10 Oct to 9 Nov 2026 | % of market cap |
|---|---|---|---|
| Humanity Protocol (H) | 21% | 262.6M H ($15.8M), vesting daily | |
| Plasma (XPL) | N/A | 227.8M XPL ($19.3M), on 25 October | |
| Worldcoin (WLD) | 38% | 88.5M WLD ($44.9M) | |
| Arbitrum (ARB) | 68% | 107.0M ARB ($19.6M) |
The smallest dollar amount, Humanity Protocol's $15.8M, is the largest against its float: about 12% more circulating supply in a month. Worldcoin releases nearly three times as much in dollars, only 2.3% of its market cap. Scheduled, per Token Radar's modeled schedule (estimated from project documentation); market data as of 10 October 2026, 01:00 UTC, unlocks captured 02:08 UTC.
To go from the gap to the timing, read our explainer on what a token unlock is, then check the schedule itself with the steps in our guide to finding upcoming token unlocks. For the largest unlocks of the current month, see token unlocks this month.
When does FDV mislead?
FDV is simple arithmetic on one supply figure, so it misleads whenever that figure, or the assumption about price, is off. Four cases on real tokens:
- It prices future tokens at today's price. $3.15B of Worldcoin's $5.09B FDV values 6.2 billion WLD that do not circulate yet, at $0.5089 each. They will trade at whatever the price is when they unlock.
- No max supply means N/A, not no dilution. Plasma (XPL) has no max supply recorded, so its FDV shows N/A, yet 227.8 million XPL are scheduled to unlock on 25 October 2026. Ethereum has no max supply recorded either.
- A max supply is not always a ceiling. Arbitrum's 10 billion is its initial supply: "New $ARB can be minted at a rate of 2% of its supply per year at most" (Arbitrum docs), and its Tokenomics tab notes the same limit.
- Burns shrink the real cap. BNB's FDV uses a max supply of 200 million, but its Auto-Burn aims "to reduce its total supply to 100,000,000 BNB" (BNB Burn), below the 133.2 million already circulating. At 100 million, the fully diluted figure ($74.3B) would sit below today's market cap ($98.8B).
The practical rule: read FDV together with the unlock schedule and the emission and burn rules, not as a valuation target. Data as of 10 October 2026, 01:00 UTC, source: Token Radar.
How to check supply and FDV on Token Radar
The Market Data tile on each token page shows the gap, the Tokenomics tab shows when it closes, and the token unlocks overview turns it into dated events.
On the Market Data tile of a token page, for example Arbitrum:
- Marketcap ($): the value of the circulating supply.
- Fully Diluted Value ($): max supply × current price, N/A when no max supply is recorded.
- Circulating Supply: circulating as a share of max supply, the ratio from above, labelled LOW, MEDIUM or HIGH.
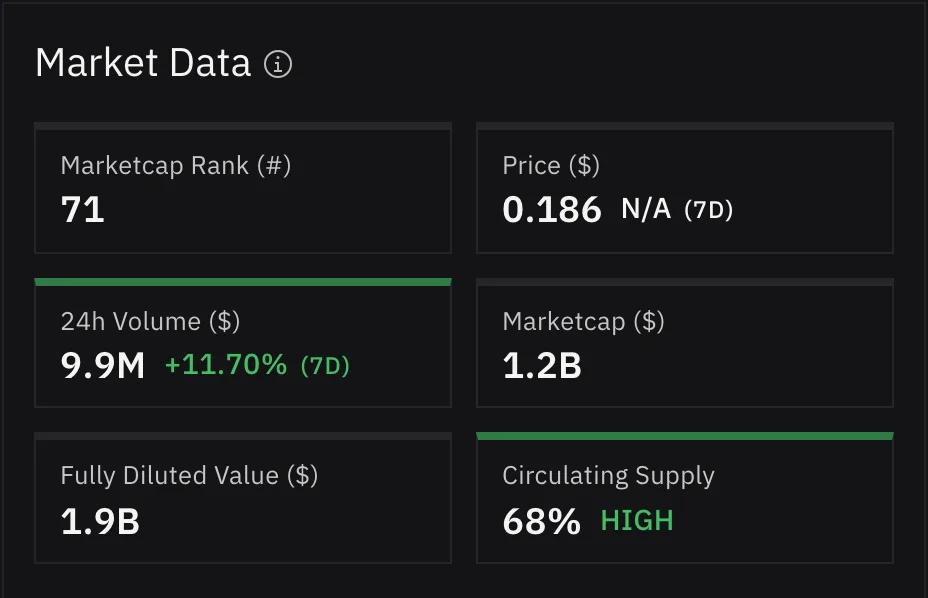 Arbitrum (ARB): 68% circulates, labelled HIGH
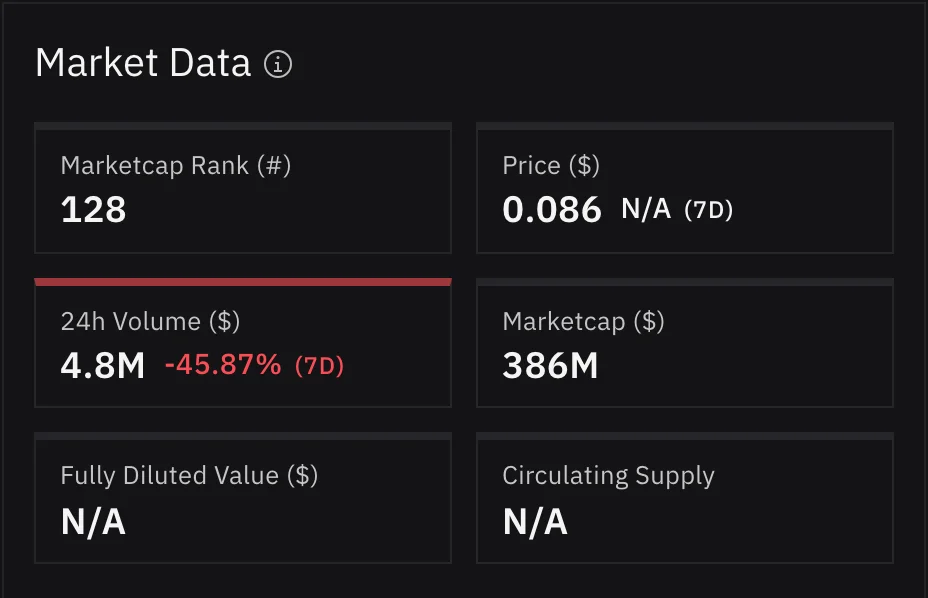 Plasma (XPL): no max supply, so FDV and Circulating Supply show N/A
Arbitrum reads 68%, HIGH. Its Tokenomics tab shows where the rest comes from: the unlock chart stacks each allocation over time, with monthly team and investor installments running until March 2027. These figures are modeled from project documentation, so they can differ from the Market Data tile.
For dated events across tokens, the token unlocks overview has a % MCap column: each unlock as a share of market cap, highlighted from 2.5% and more strongly from 5%. The Help Center explains each field (Token Details Overview, Token Tokenomics, vocabulary); for how FDV fits with allocations, vesting and emissions, read our guide to how tokenomics works.