
Market Overview in 3 Views
A short tour from the whole market to a single token: start on the Dashboard, compare sectors and blockchains, then drill down.
 Written by taika · Creator of Token Radar
 Each view answers a different question, and all three use the time range you choose at the top right of the page.
1. Dashboard: the Market at a Glance
Start on the Dashboard. It shows which tokens performed best in your time range (Top Tokens and Top Gainer), today's news with an AI summary, and which sectors and blockchains the best performers belong to.
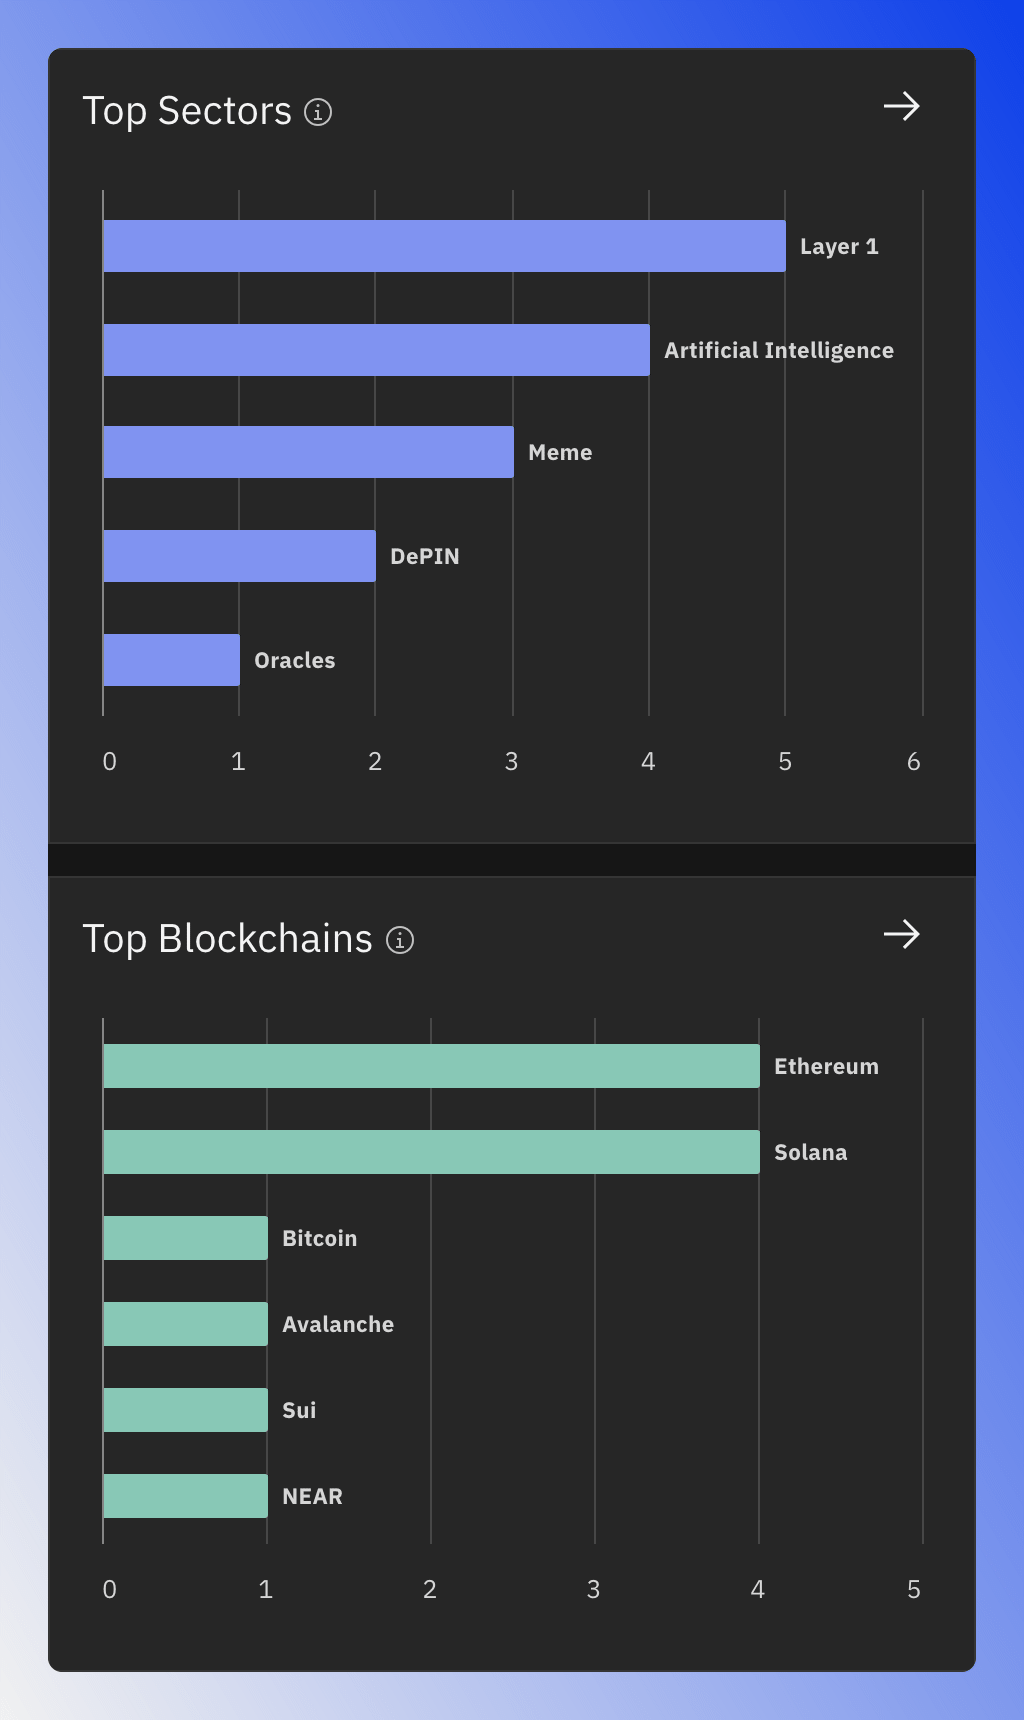
Top Sectors and Top Blockchains count how many of the 24 best-performing tokens belong to each sector or blockchain. They tell you where the strongest tokens are, and they are your way into the next two views. Details: Dashboard Overview.
2. Sectors: Which Narratives Lead
Sectors group tokens by what they do, such as AI, memes or oracles. Each sector has an index that combines the performance of all its tokens into one number, so you can compare whole sectors instead of single tokens.
- Overview ranks the sector indices and lets you choose how they are calculated, see Sectors Overview.
- Index Charts shows a chart for each sector index, and Token Charts compares the top six tokens of each sector.
- News Mentions and Social Mindshare show how often each sector's tokens come up in the news and on X.
3. Blockchains: Which Ecosystems Lead
Blockchains work the same way, with one index per blockchain made of the tokens in its ecosystem. The same tabs are there, and the index settings can include or exclude the chain's native token, such as ETH. See Blockchains Overview.
Drill Down to a Token
Click a sector or blockchain to open its details page. Its Overview shows which of its tokens do best, next to the tabs Preview Charts, News Mentions and Social Mindshare. From there, click a token to open its page, see Find Any Token.
For the full walk through each page, read Sector Details and Blockchain Details.