Dashboard Overview
The Dashboard provides an overview of the crypto market, highlighting key information to start your research.
 Written by taika · Creator of Token Radar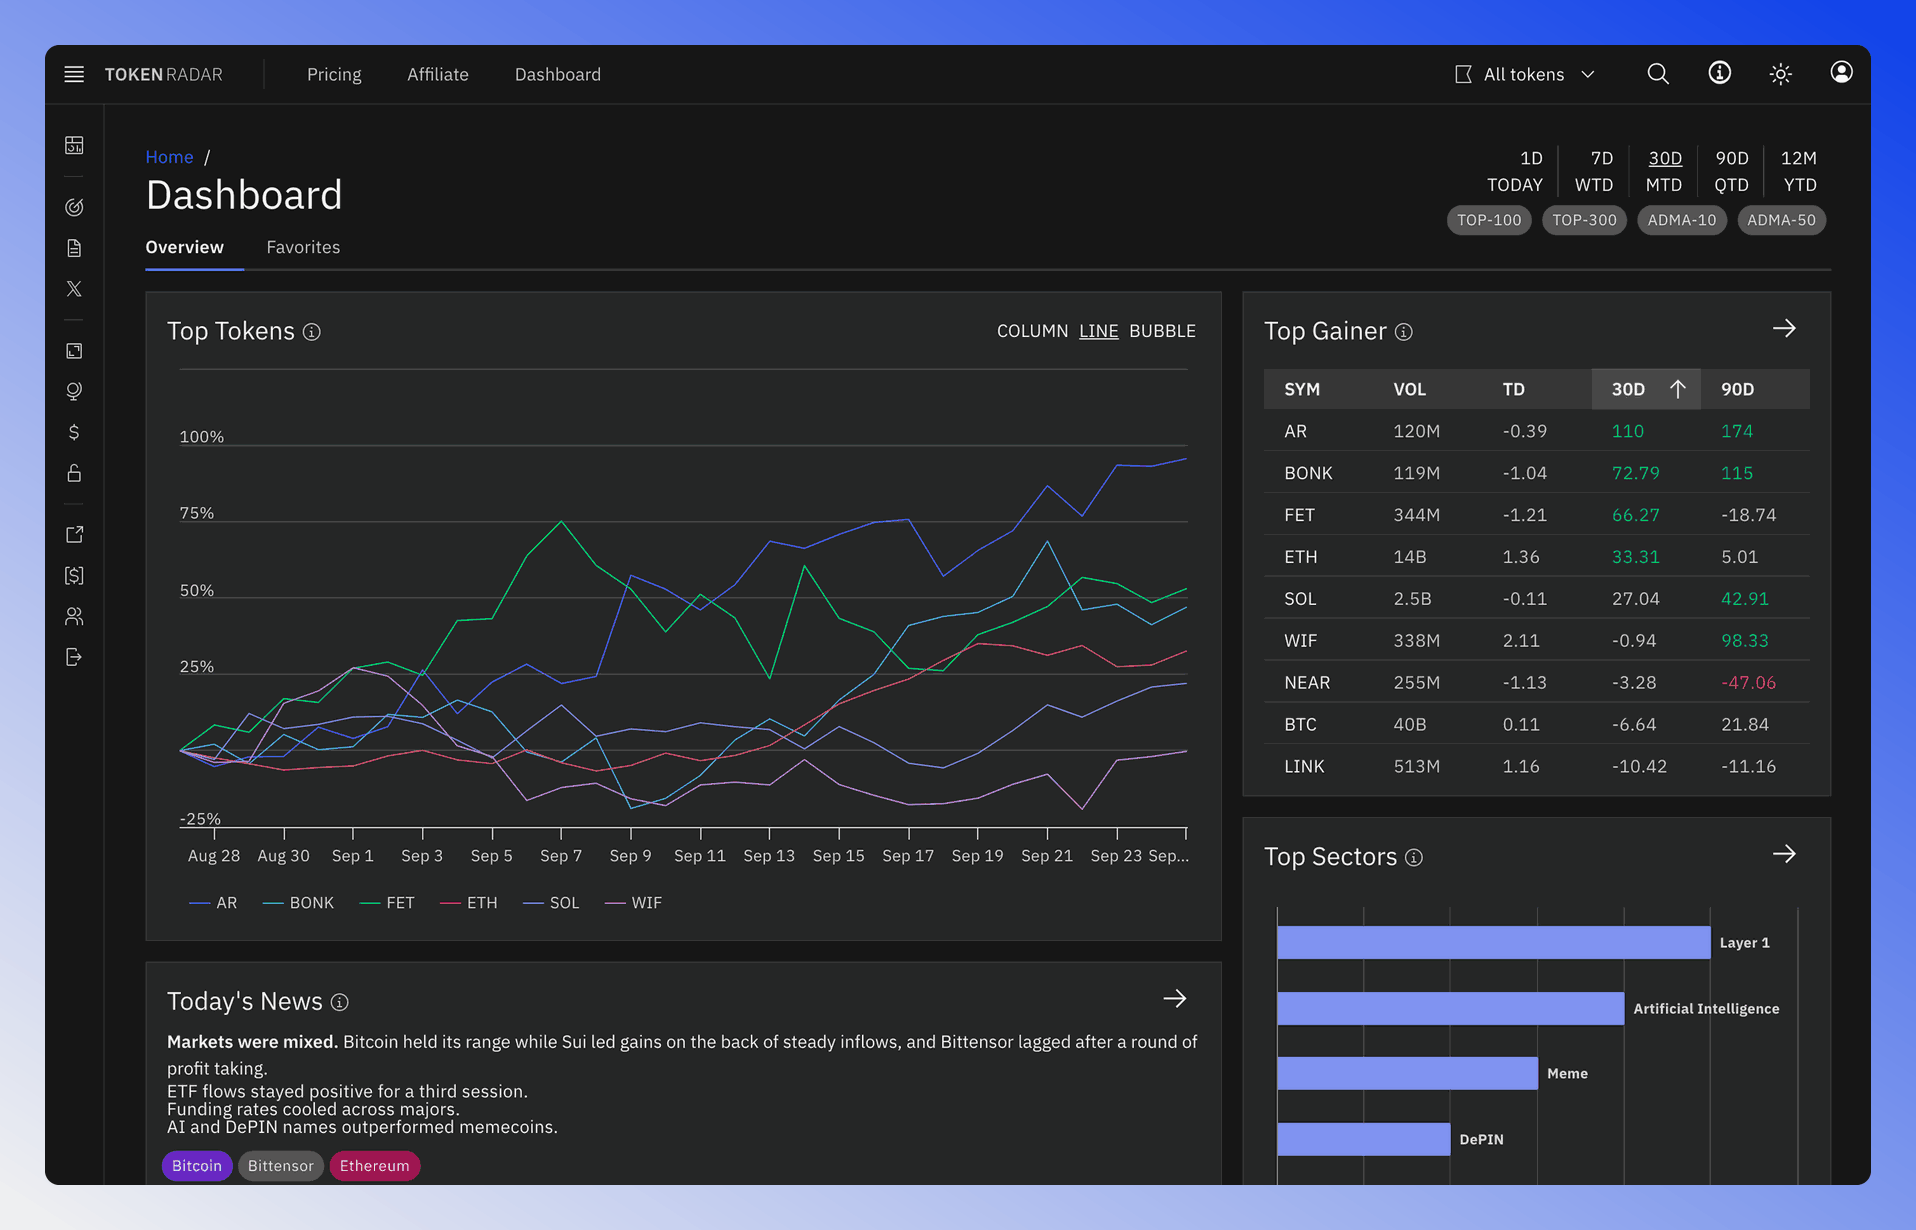
Header Filter and Time Selection
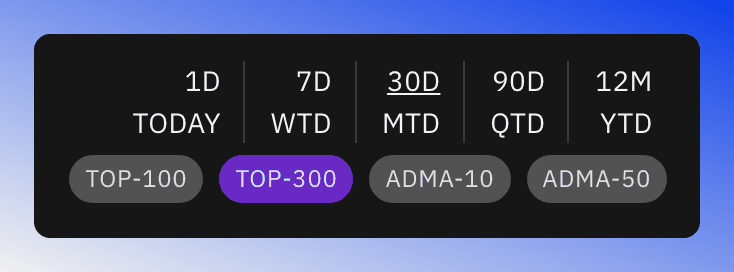
The Time and Filter component is a common feature on Token Radar. Although the specific settings may differ from page to page, the core concept stays the same. This component allows you to adjust the time range and filter settings for the entire page.
The available filter settings on the Dashboard page are:
- TOP-100: Show Tokens with "Marketcap Rank < 100"
- TOP-300: Show Tokens with "Marketcap Rank < 300"
- ADMA-10: Show Tokens Trading "Above Simple Moving Average 10"
- ADMA-50: Show Tokens Trading "Above Simple Moving Average 50"
For term explanations see vocabulary.
When you are signed in, the list menu in the header (No favorites) limits the Overview to the tokens of one of your favorites lists. The Favorites tab shows the dashboard for the selected list.
Top Tokens
The Top Tokens chart shows the 6 assets with the strongest relative performance based on the selected time period and filters.
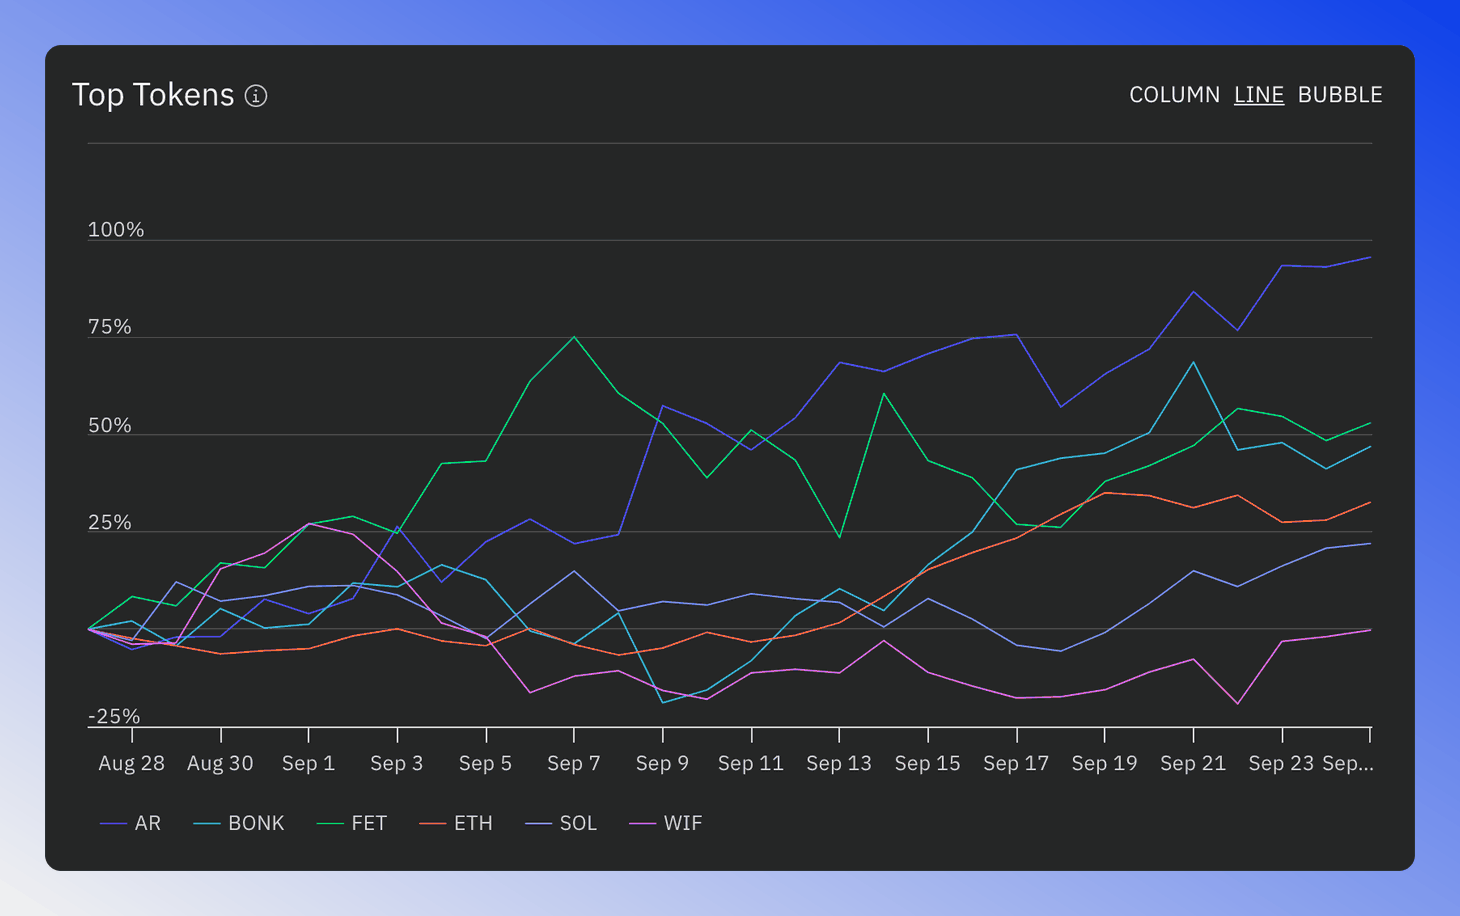
Use COLUMN, LINE and BUBBLE at the top of the chart to switch between a column chart, the performance over time and a bubble chart. To change the time period or filters, use the main time and filter selector at the top right of the page.
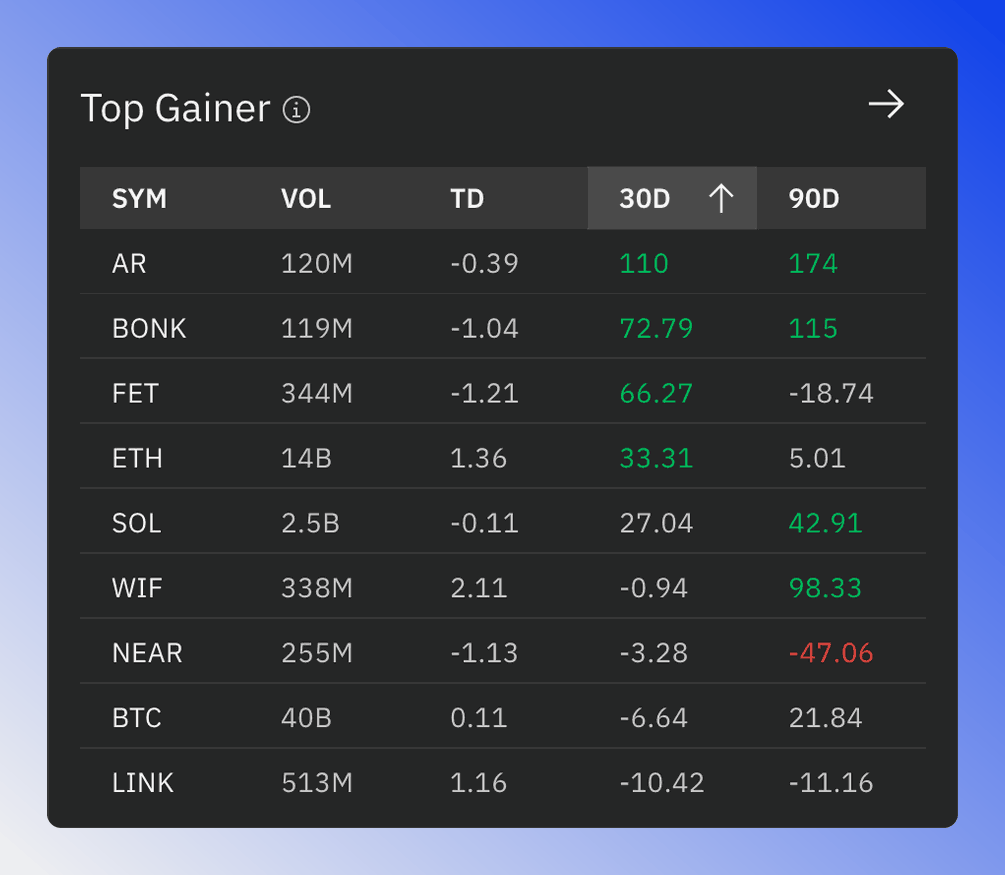
Top Gainer
The Top Gainer table displays the best-performing assets in a table format, with their trading volume and price changes.
The content and columns are determined by the page's time and filter settings.
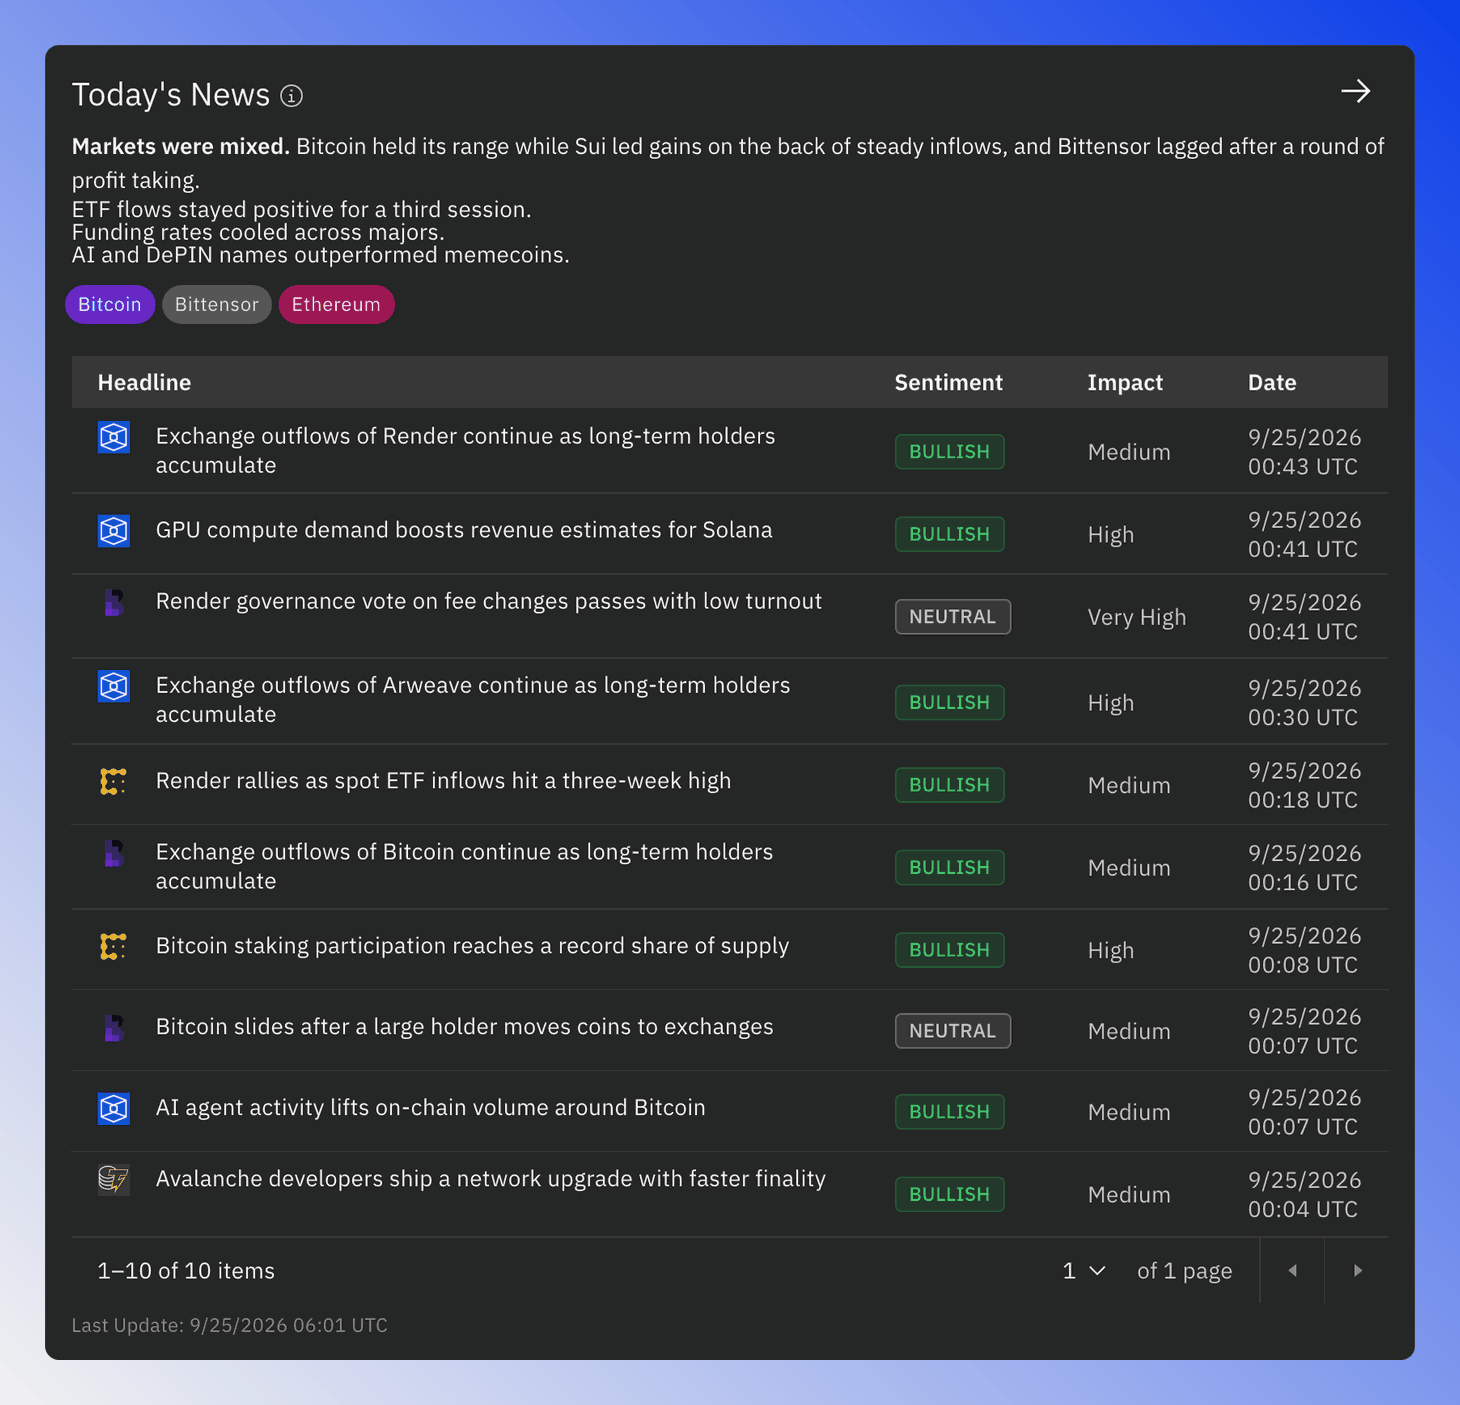
Today's News
This section starts with an AI-generated summary of the day's news, followed by recent news stories from the most important publications with their sentiment and estimated market impact.
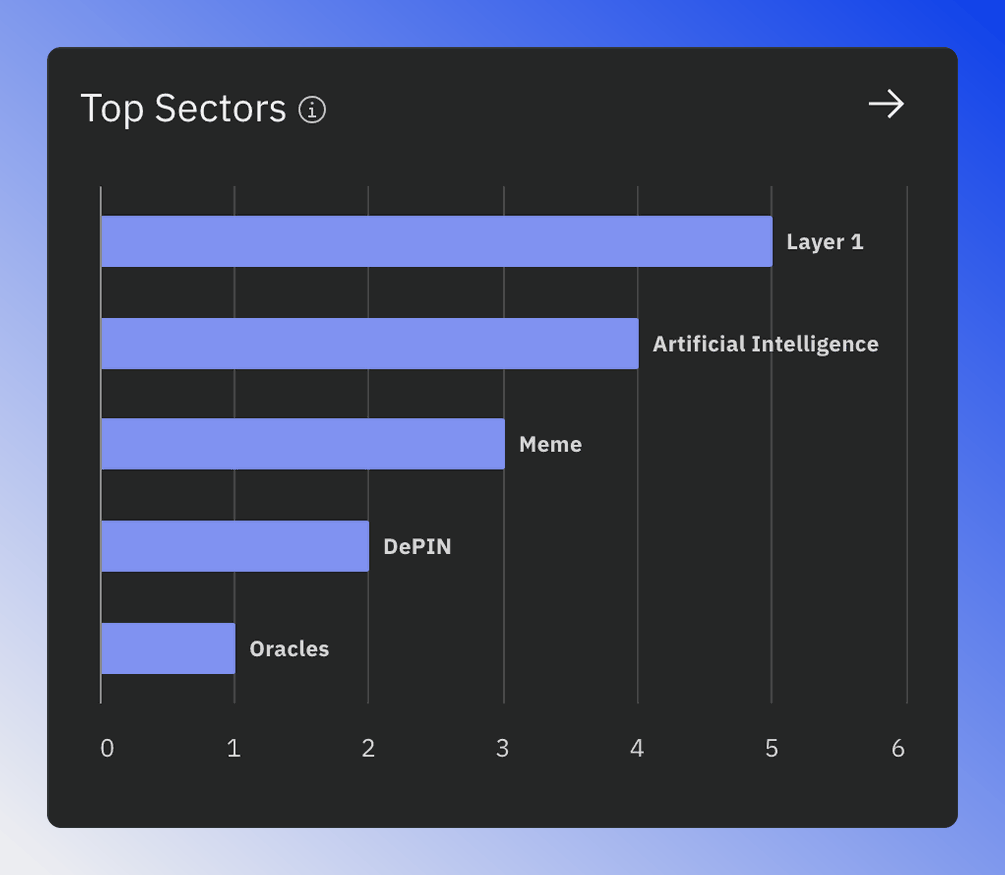
Top Sectors and Blockchains
The Top Sectors and Top Blockchains charts are designed to easily identify the top-performing sectors and blockchains.
The charts are generated by calculating the ratio of occurrences among the 24 best-performing tokens. Click on a column to open the sector's or blockchain's details page.