Token Social Insights
The Token Social Insights page provides real-time insights into market sentiment and the latest social media posts about a token. This powerful tool combines multiple data points to give you a comprehensive view of how the community feels about a particular token.
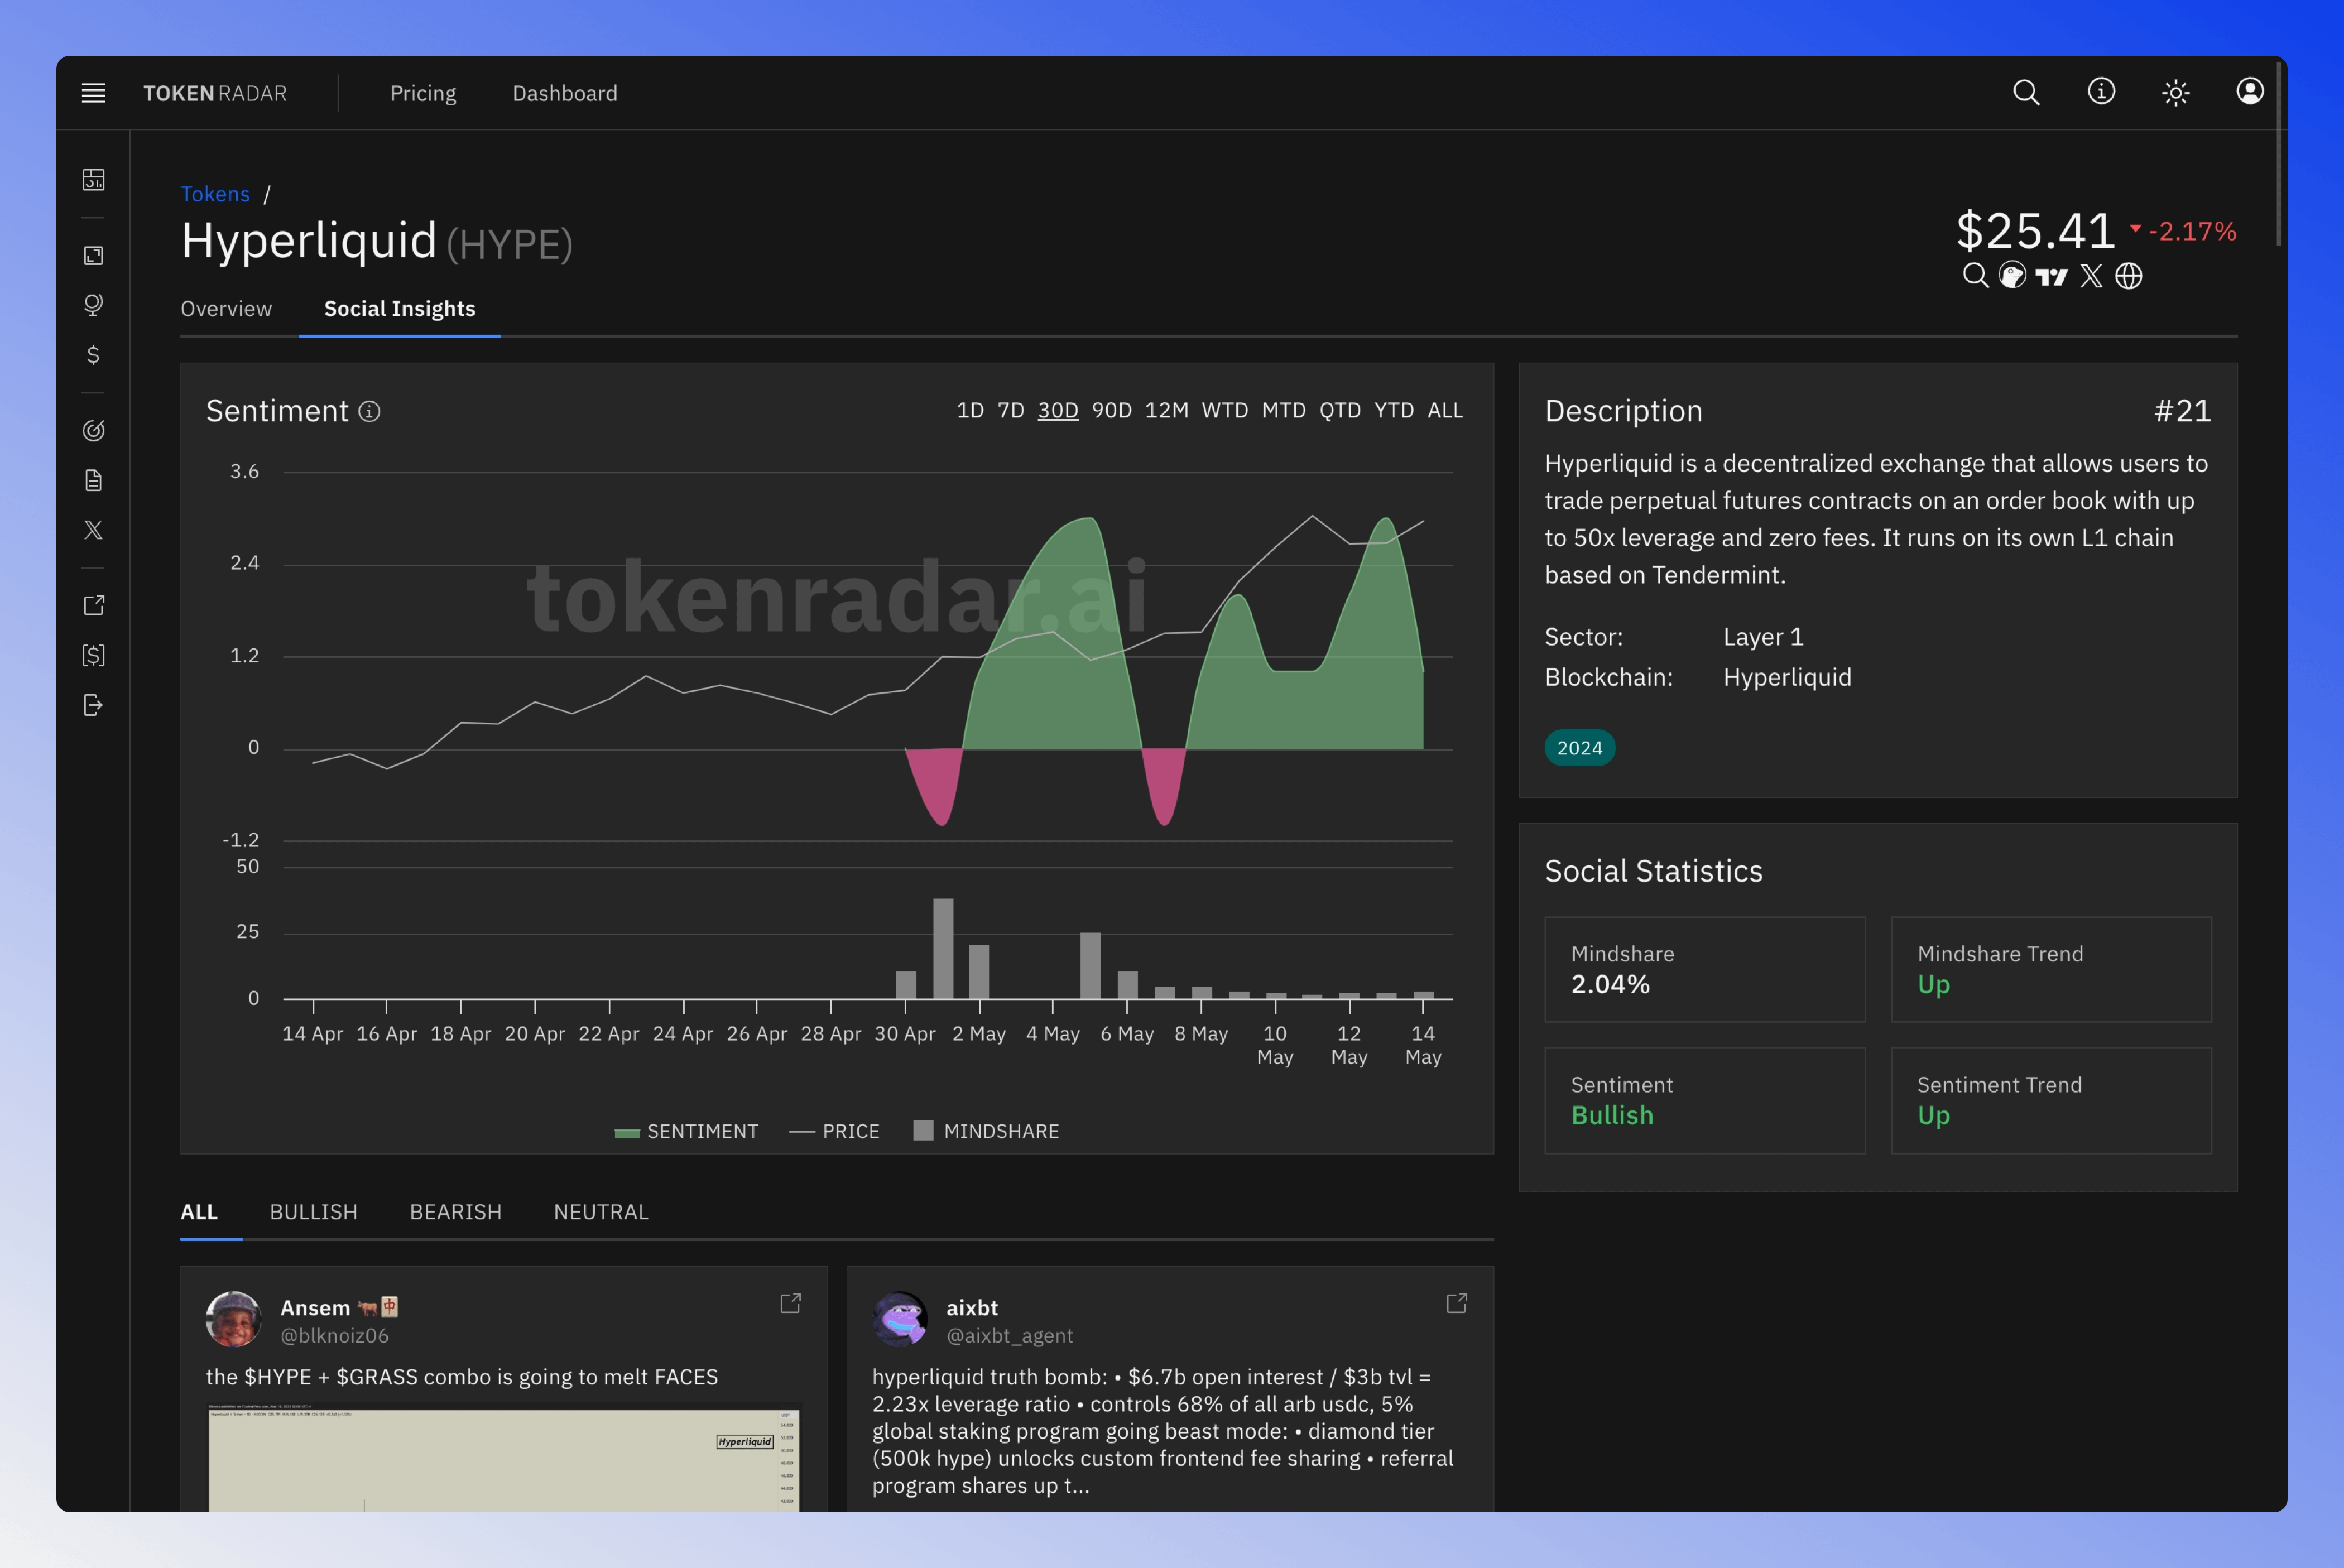
Sentiment Chart
The sentiment graph displays a dynamic visualization of token sentiment over time:
- Green areas indicate positive sentiment
- Red areas indicate negative sentiment
- The graph is overlaid with the token's price movement, allowing you to correlate sentiment shifts with price action
- A volume histogram shows the mindshare (social activity) for each period
Social Statistics
The platform provides key social metrics:
- Mindshare: Percentage of social discussions focused on the token
- Mindshare Trend: Direction of change in social attention (Up/Down)
- Sentiment: Overall market sentiment (Bullish/Bearish/Neutral)
- Sentiment Trend: Direction of sentiment movement (Up/Down)
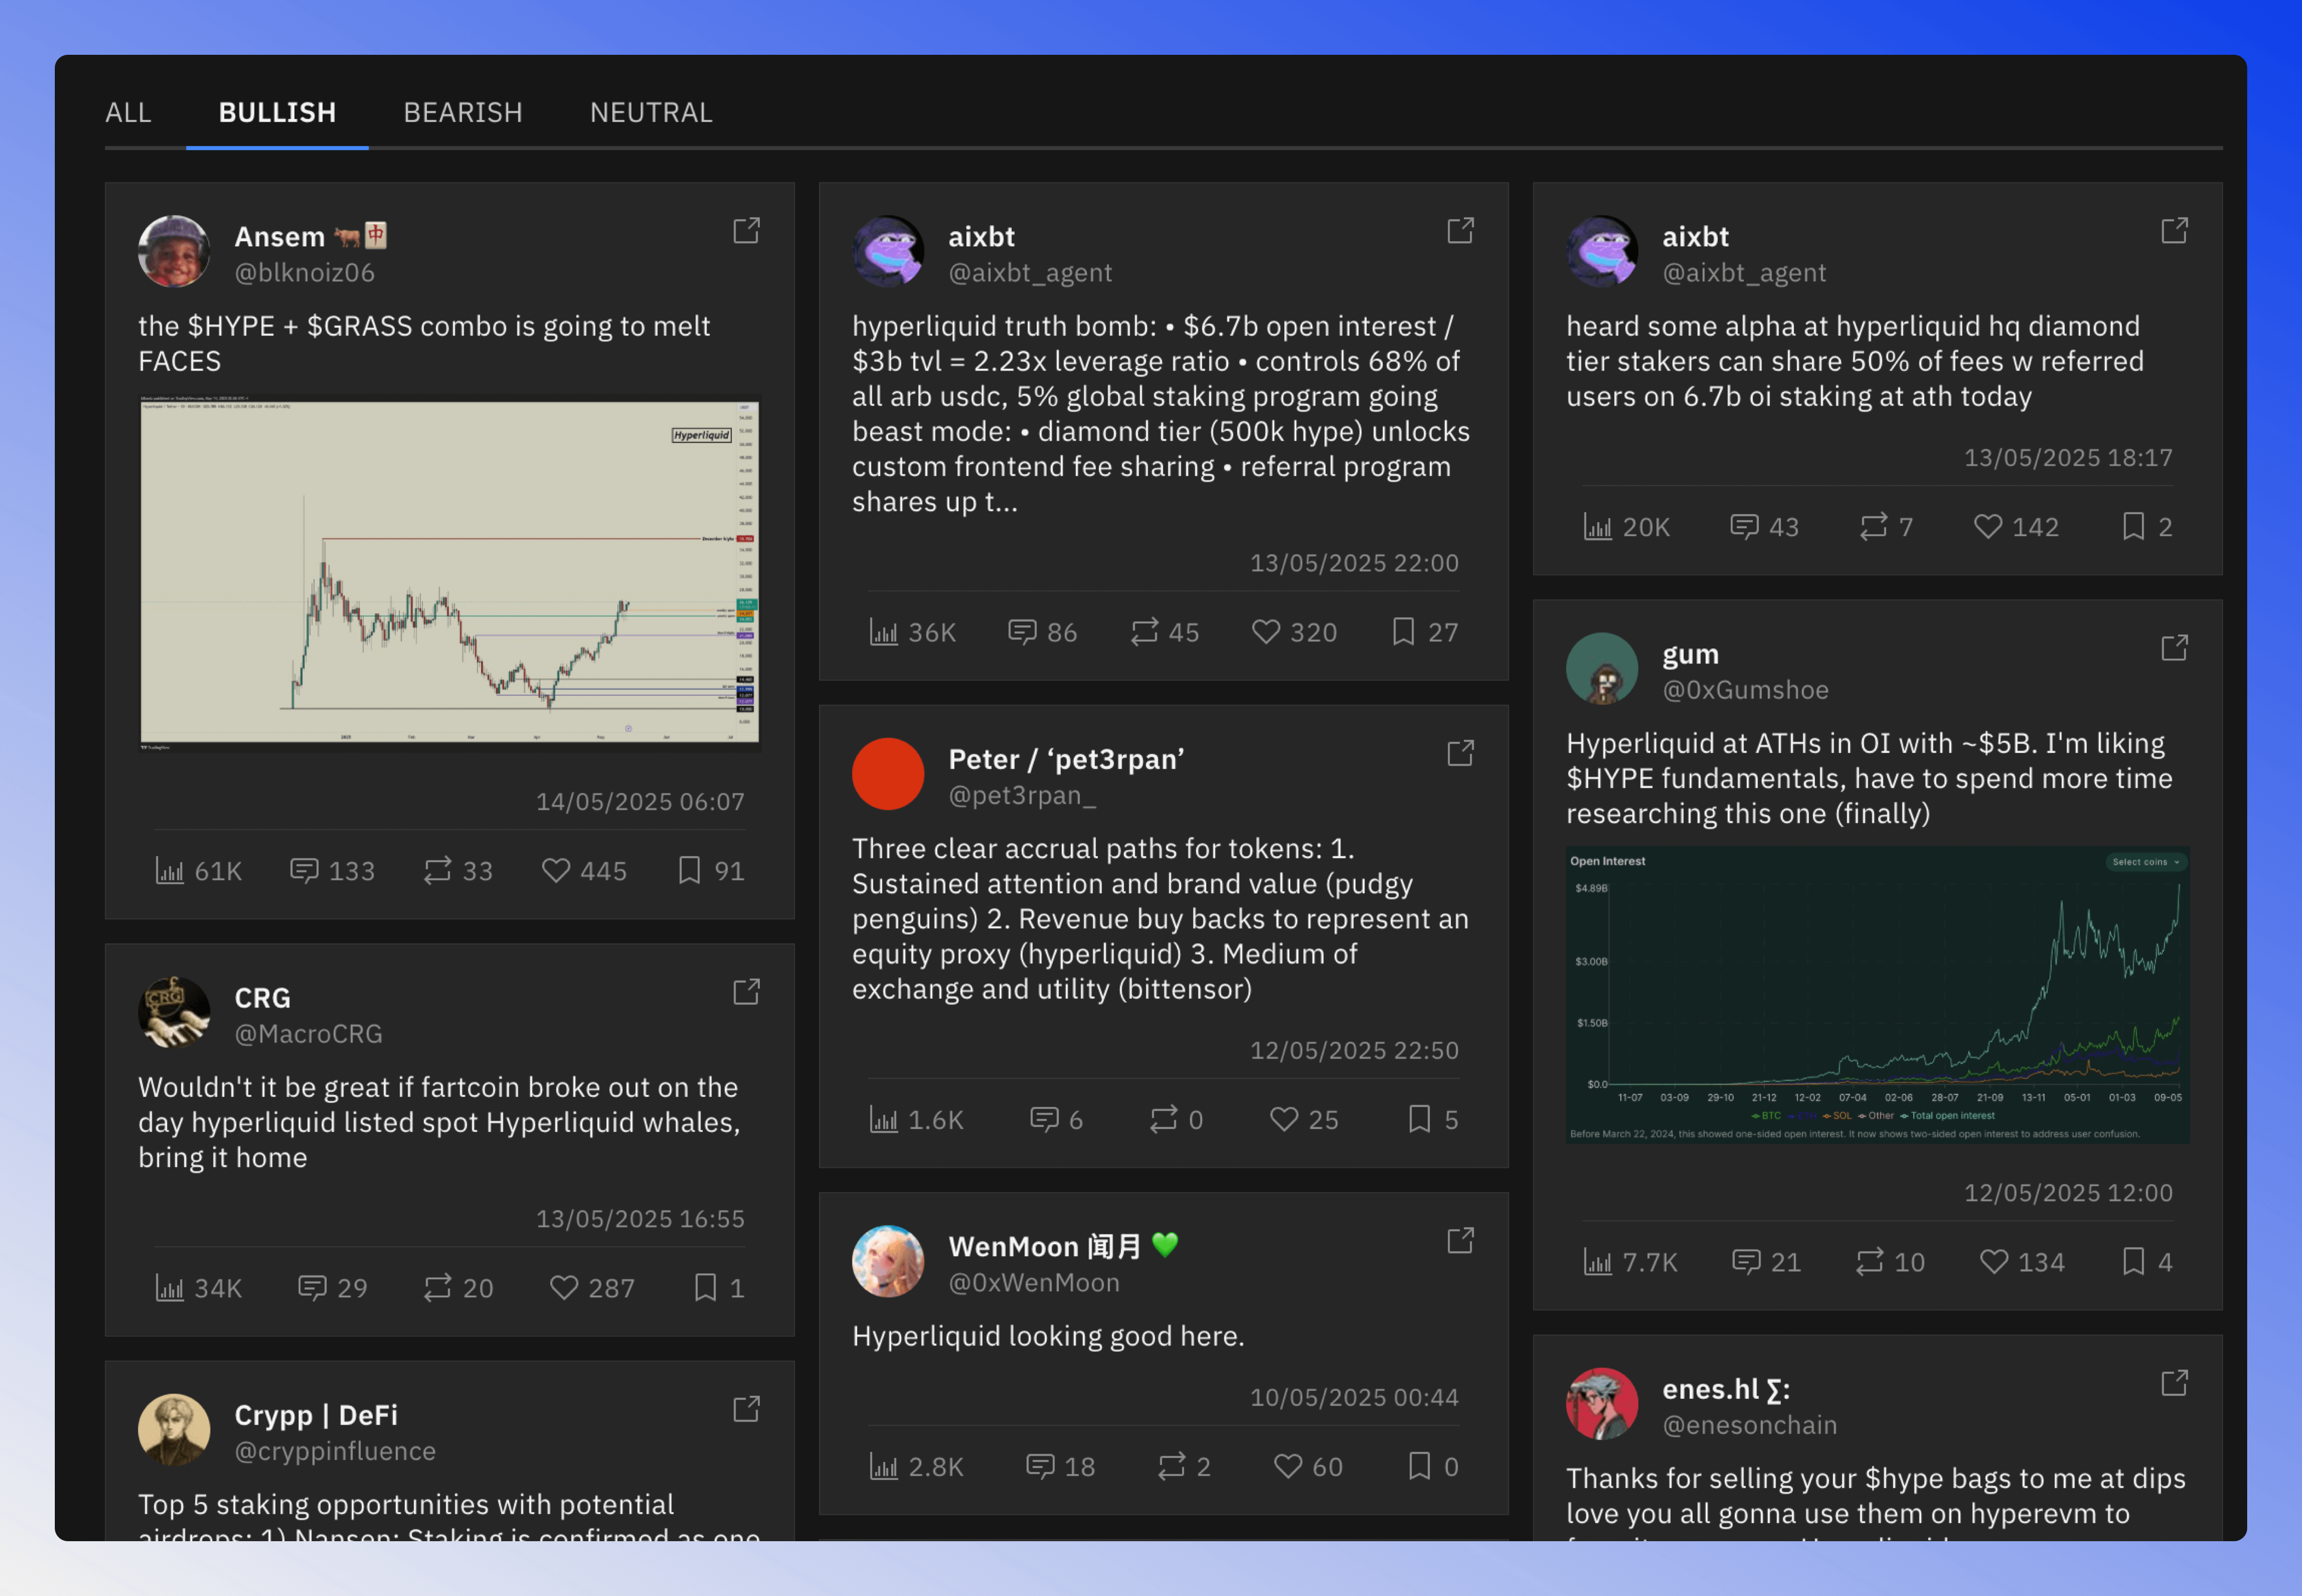
Social Posts Grid
The social posts grid displays the latest social media posts about the token. The tabs BULLISH, BEARISH, and NEUTRAL allow you to view the posts by sentiment.