Token Overview
The Token Details page provides a comprehensive overview of any token in our database. You'll find everything from real-time price data and market metrics to detailed information about the project, its latest developments, social sentiment, exchange relationships, and historical milestones.
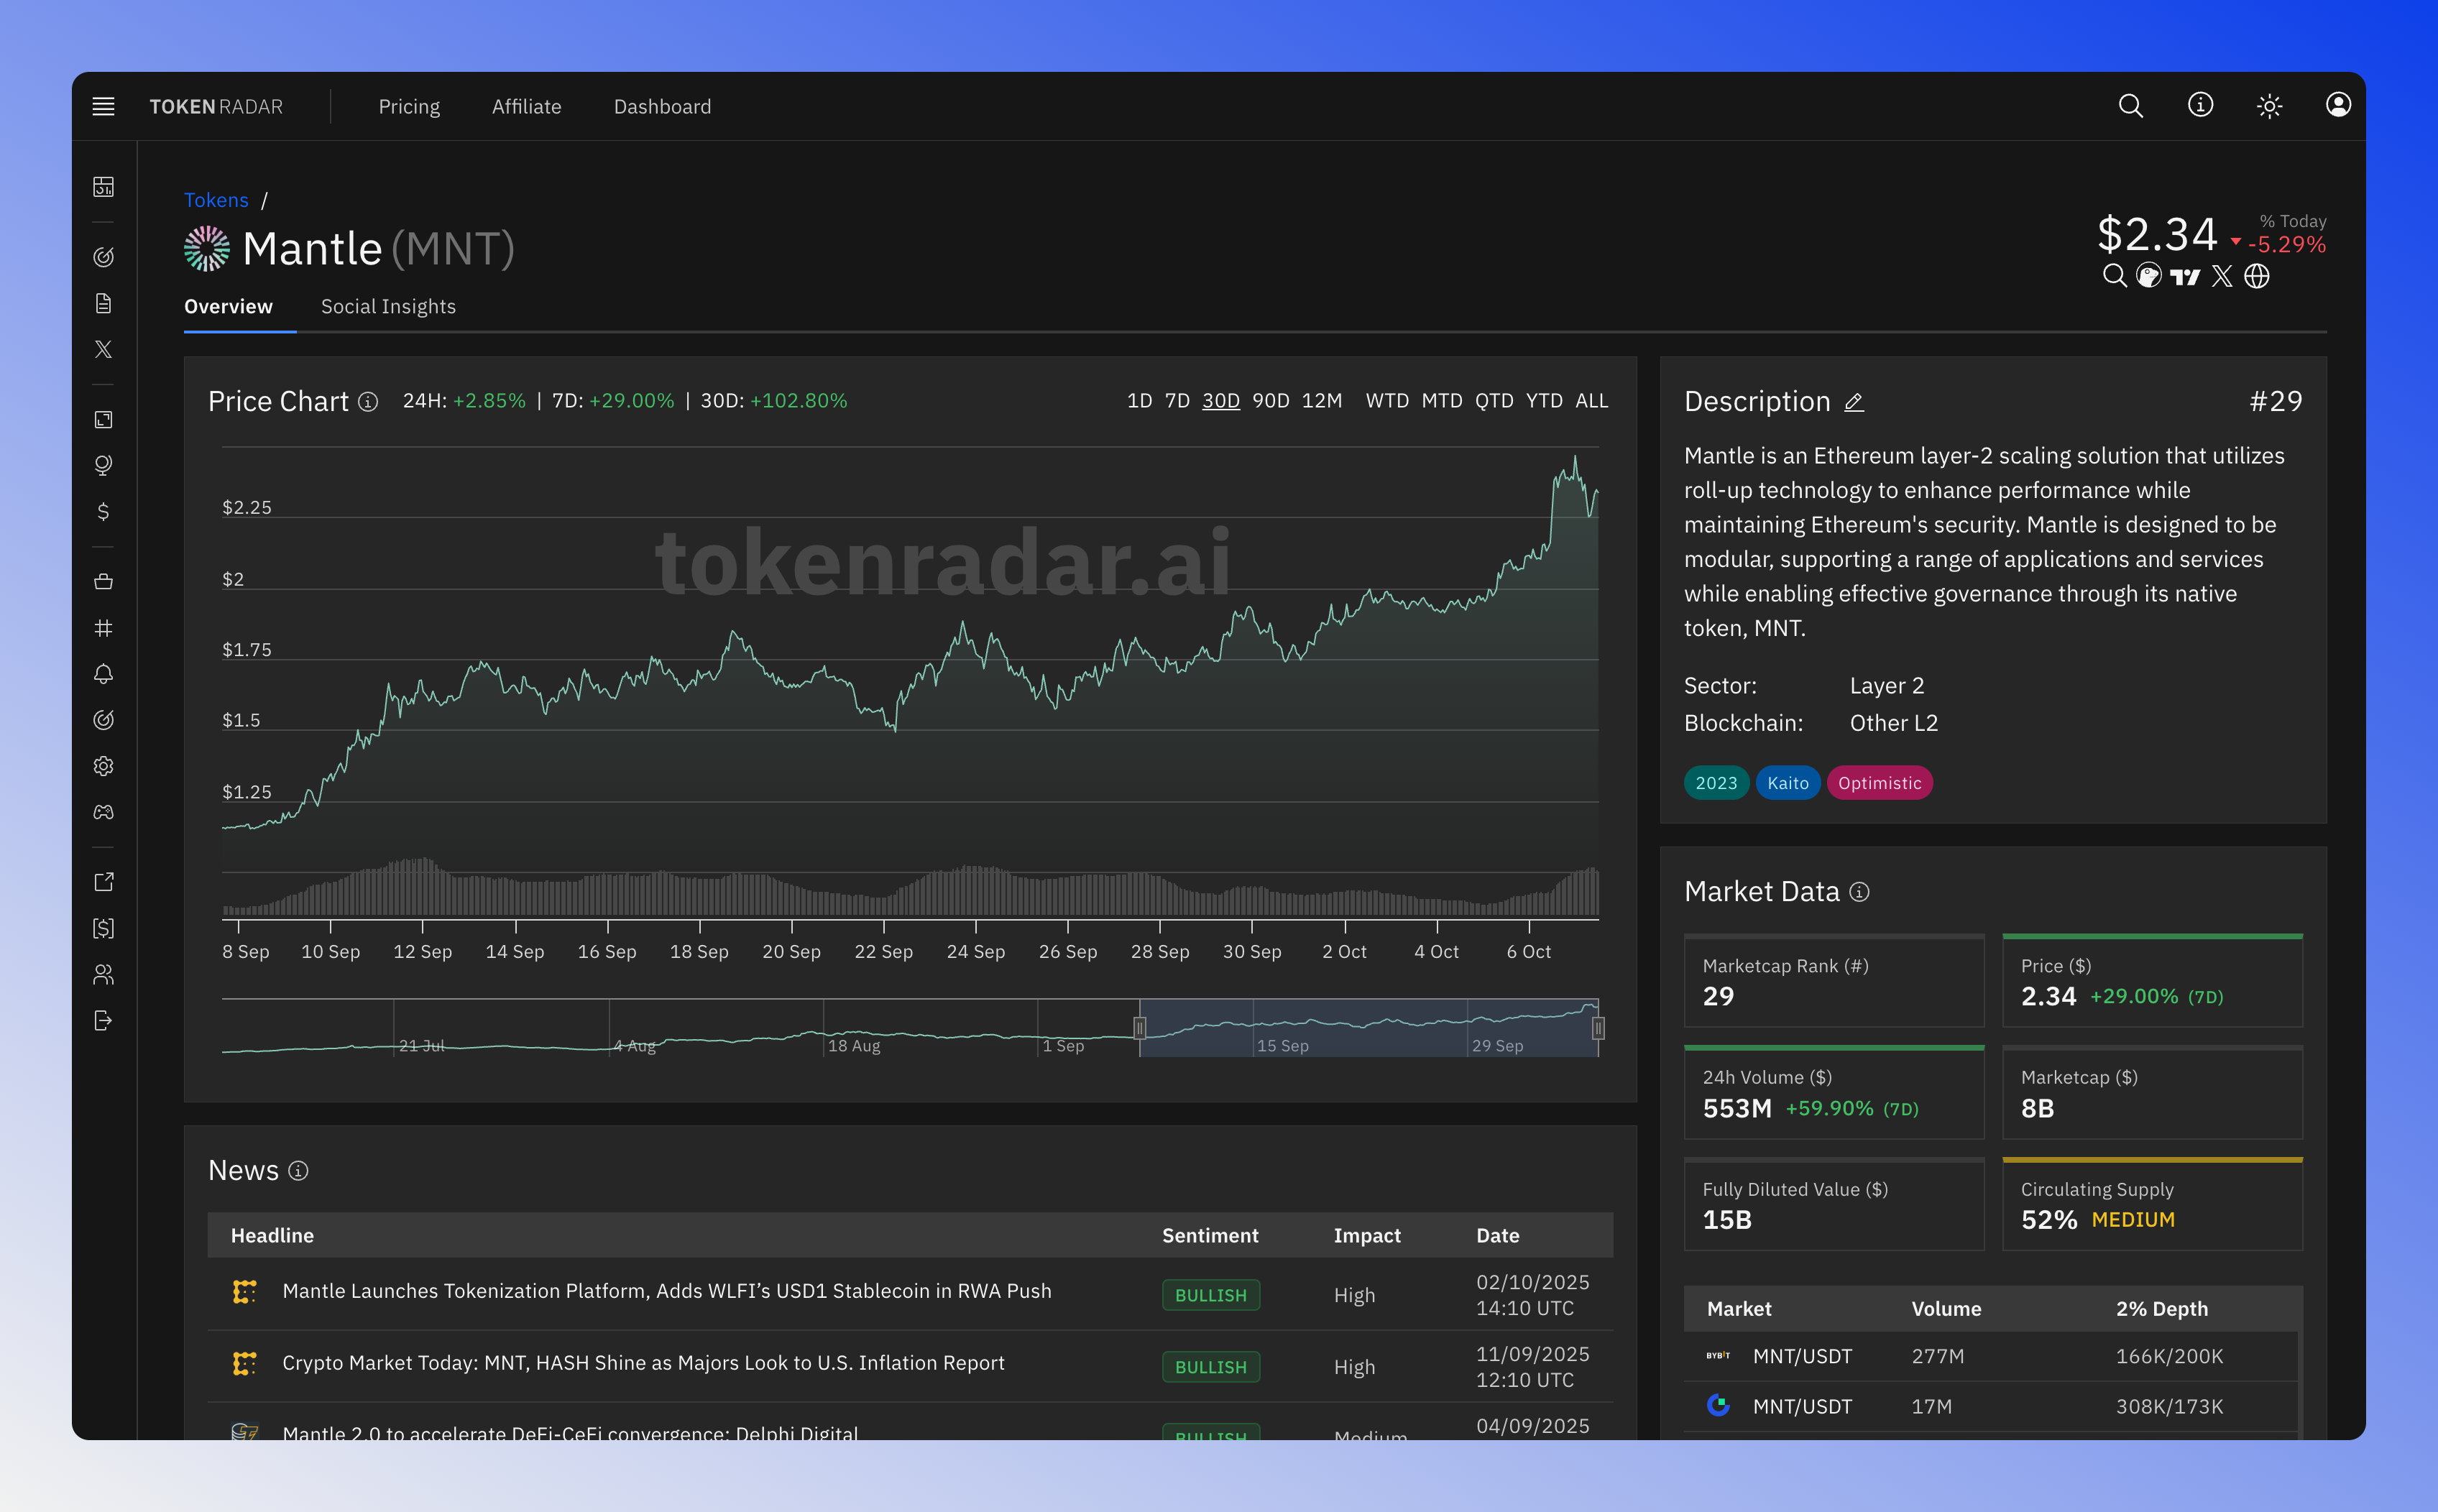
Header
At the top of the page, you'll find essential token information including its symbol, name, and the ecosystem it belongs to. The current price is prominently displayed along with the percentage change, giving you an immediate sense of the token's performance.
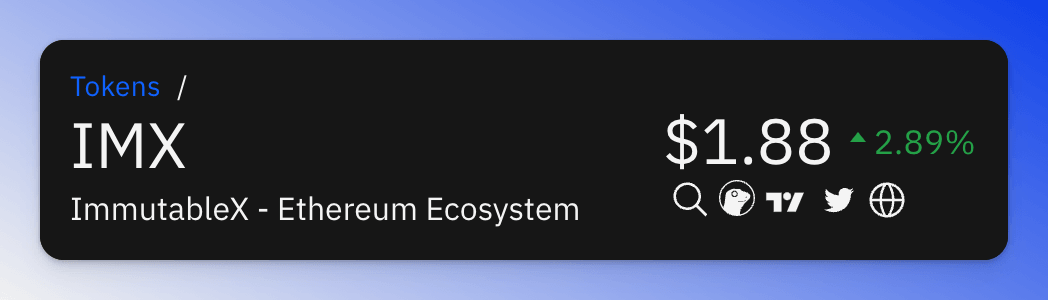
The header includes convenient quick-access links to external resources. You can easily search the token on X, view its data on Coingecko, check charts on Tradingview, explore its social presence, or visit the official website.
Prices are refreshed hourly, and you can see the last update time by hovering over the price display.
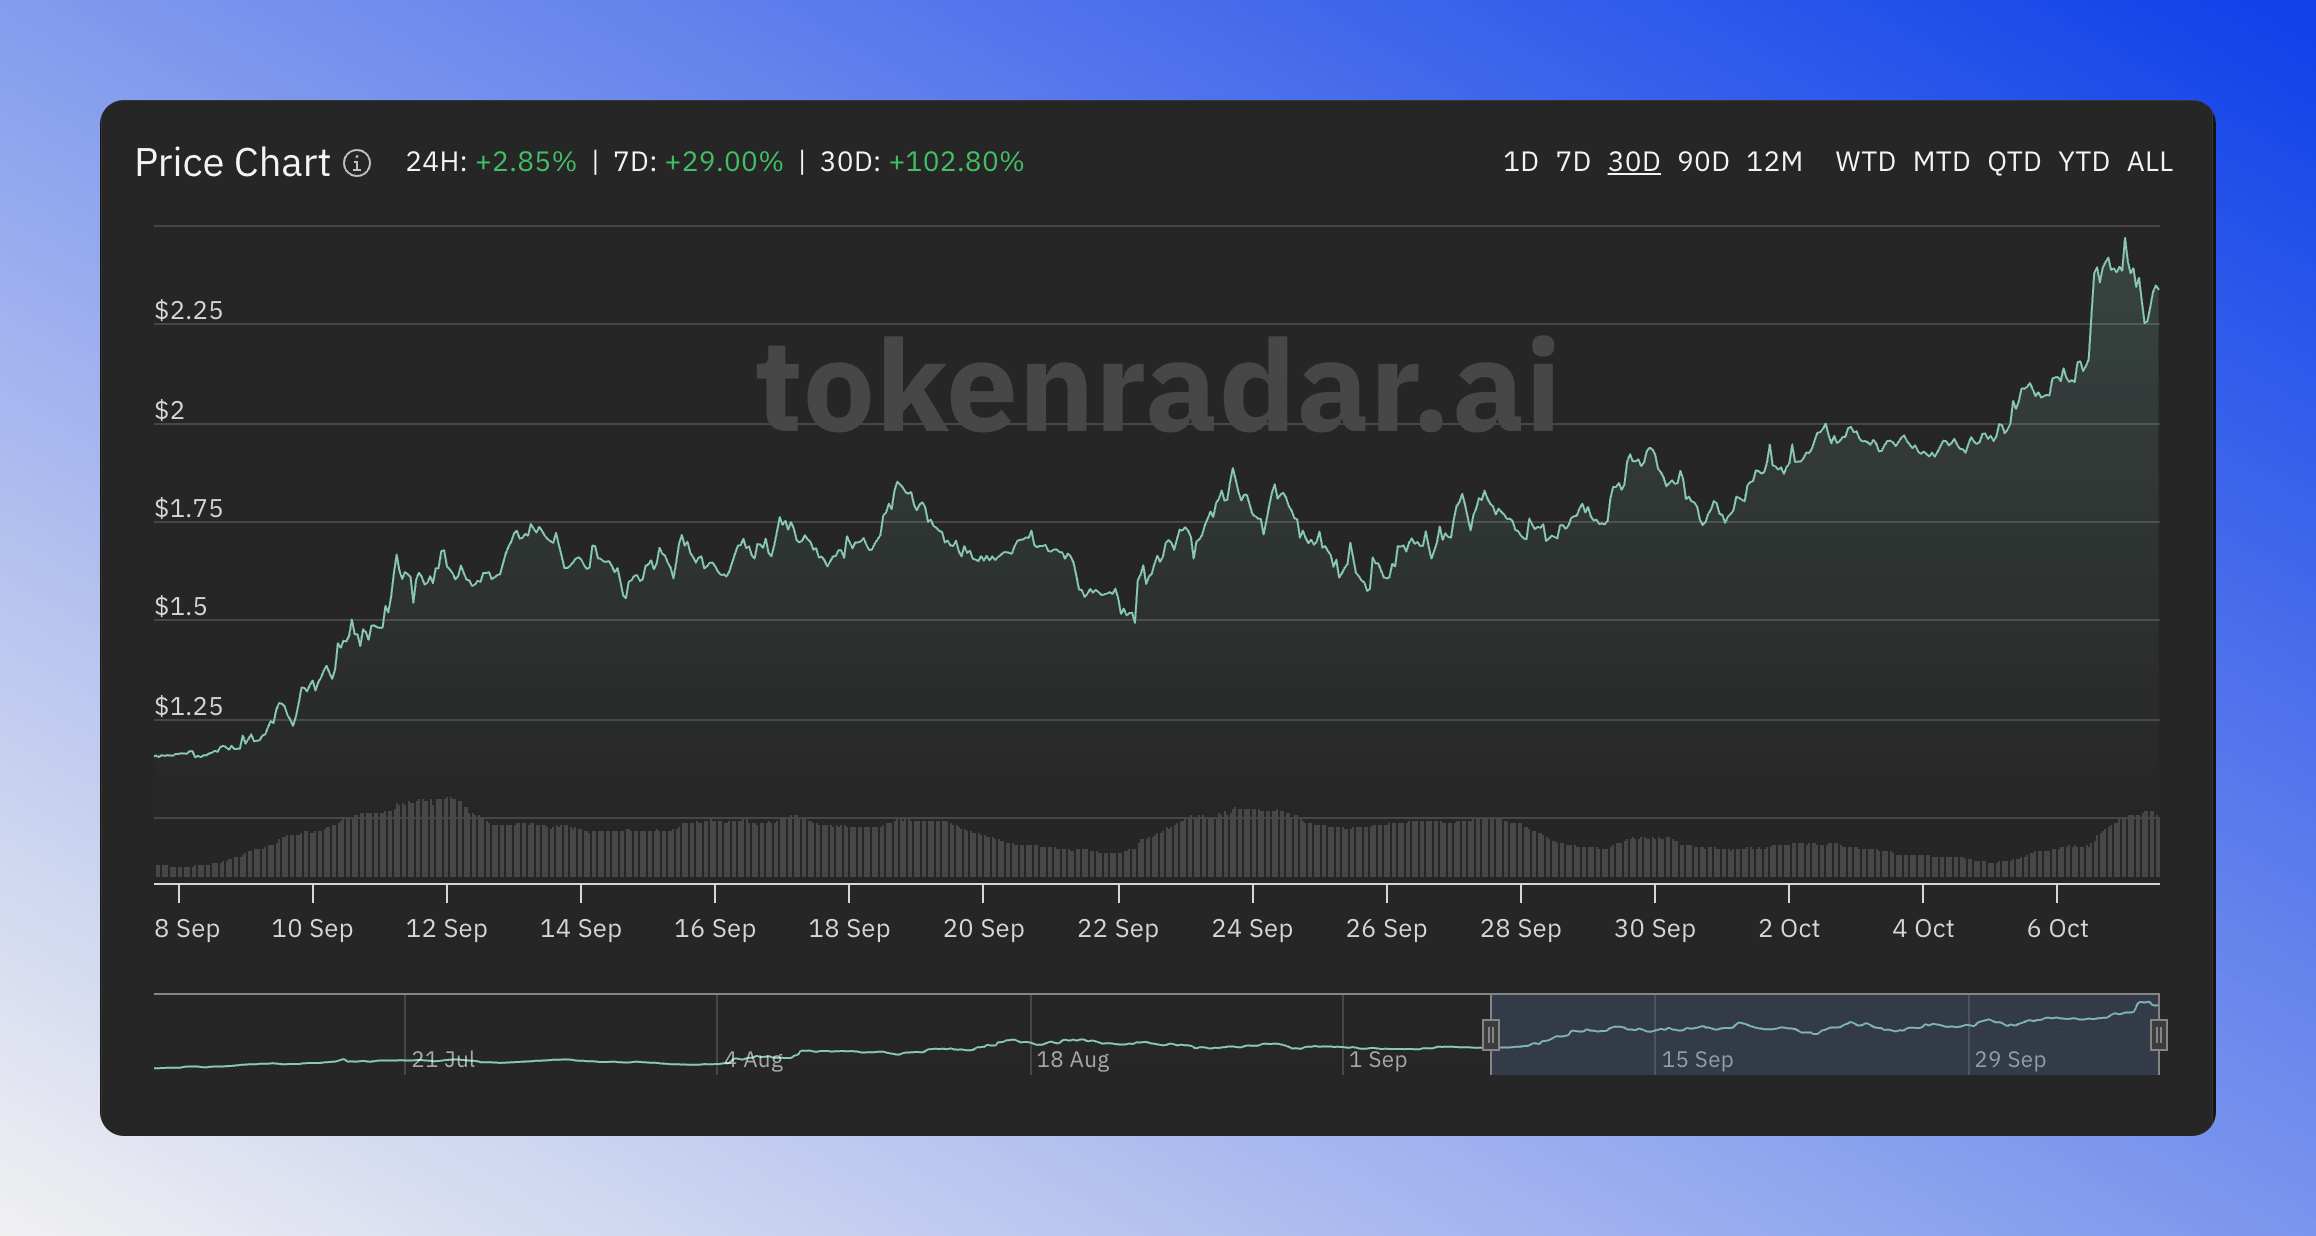
Price Chart
The interactive price chart lets you visualize the token's price history across different timeframes. You can easily switch between time periods using the range selectors above the chart, while the navigator below helps you focus on specific periods. The chart features a dynamic color system that responds to market conditions. When the price moves above both the 10-day and 50-day Simple Moving Averages (SMA), the chart shifts to a green color scheme, signaling a potential bullish trend.
Description
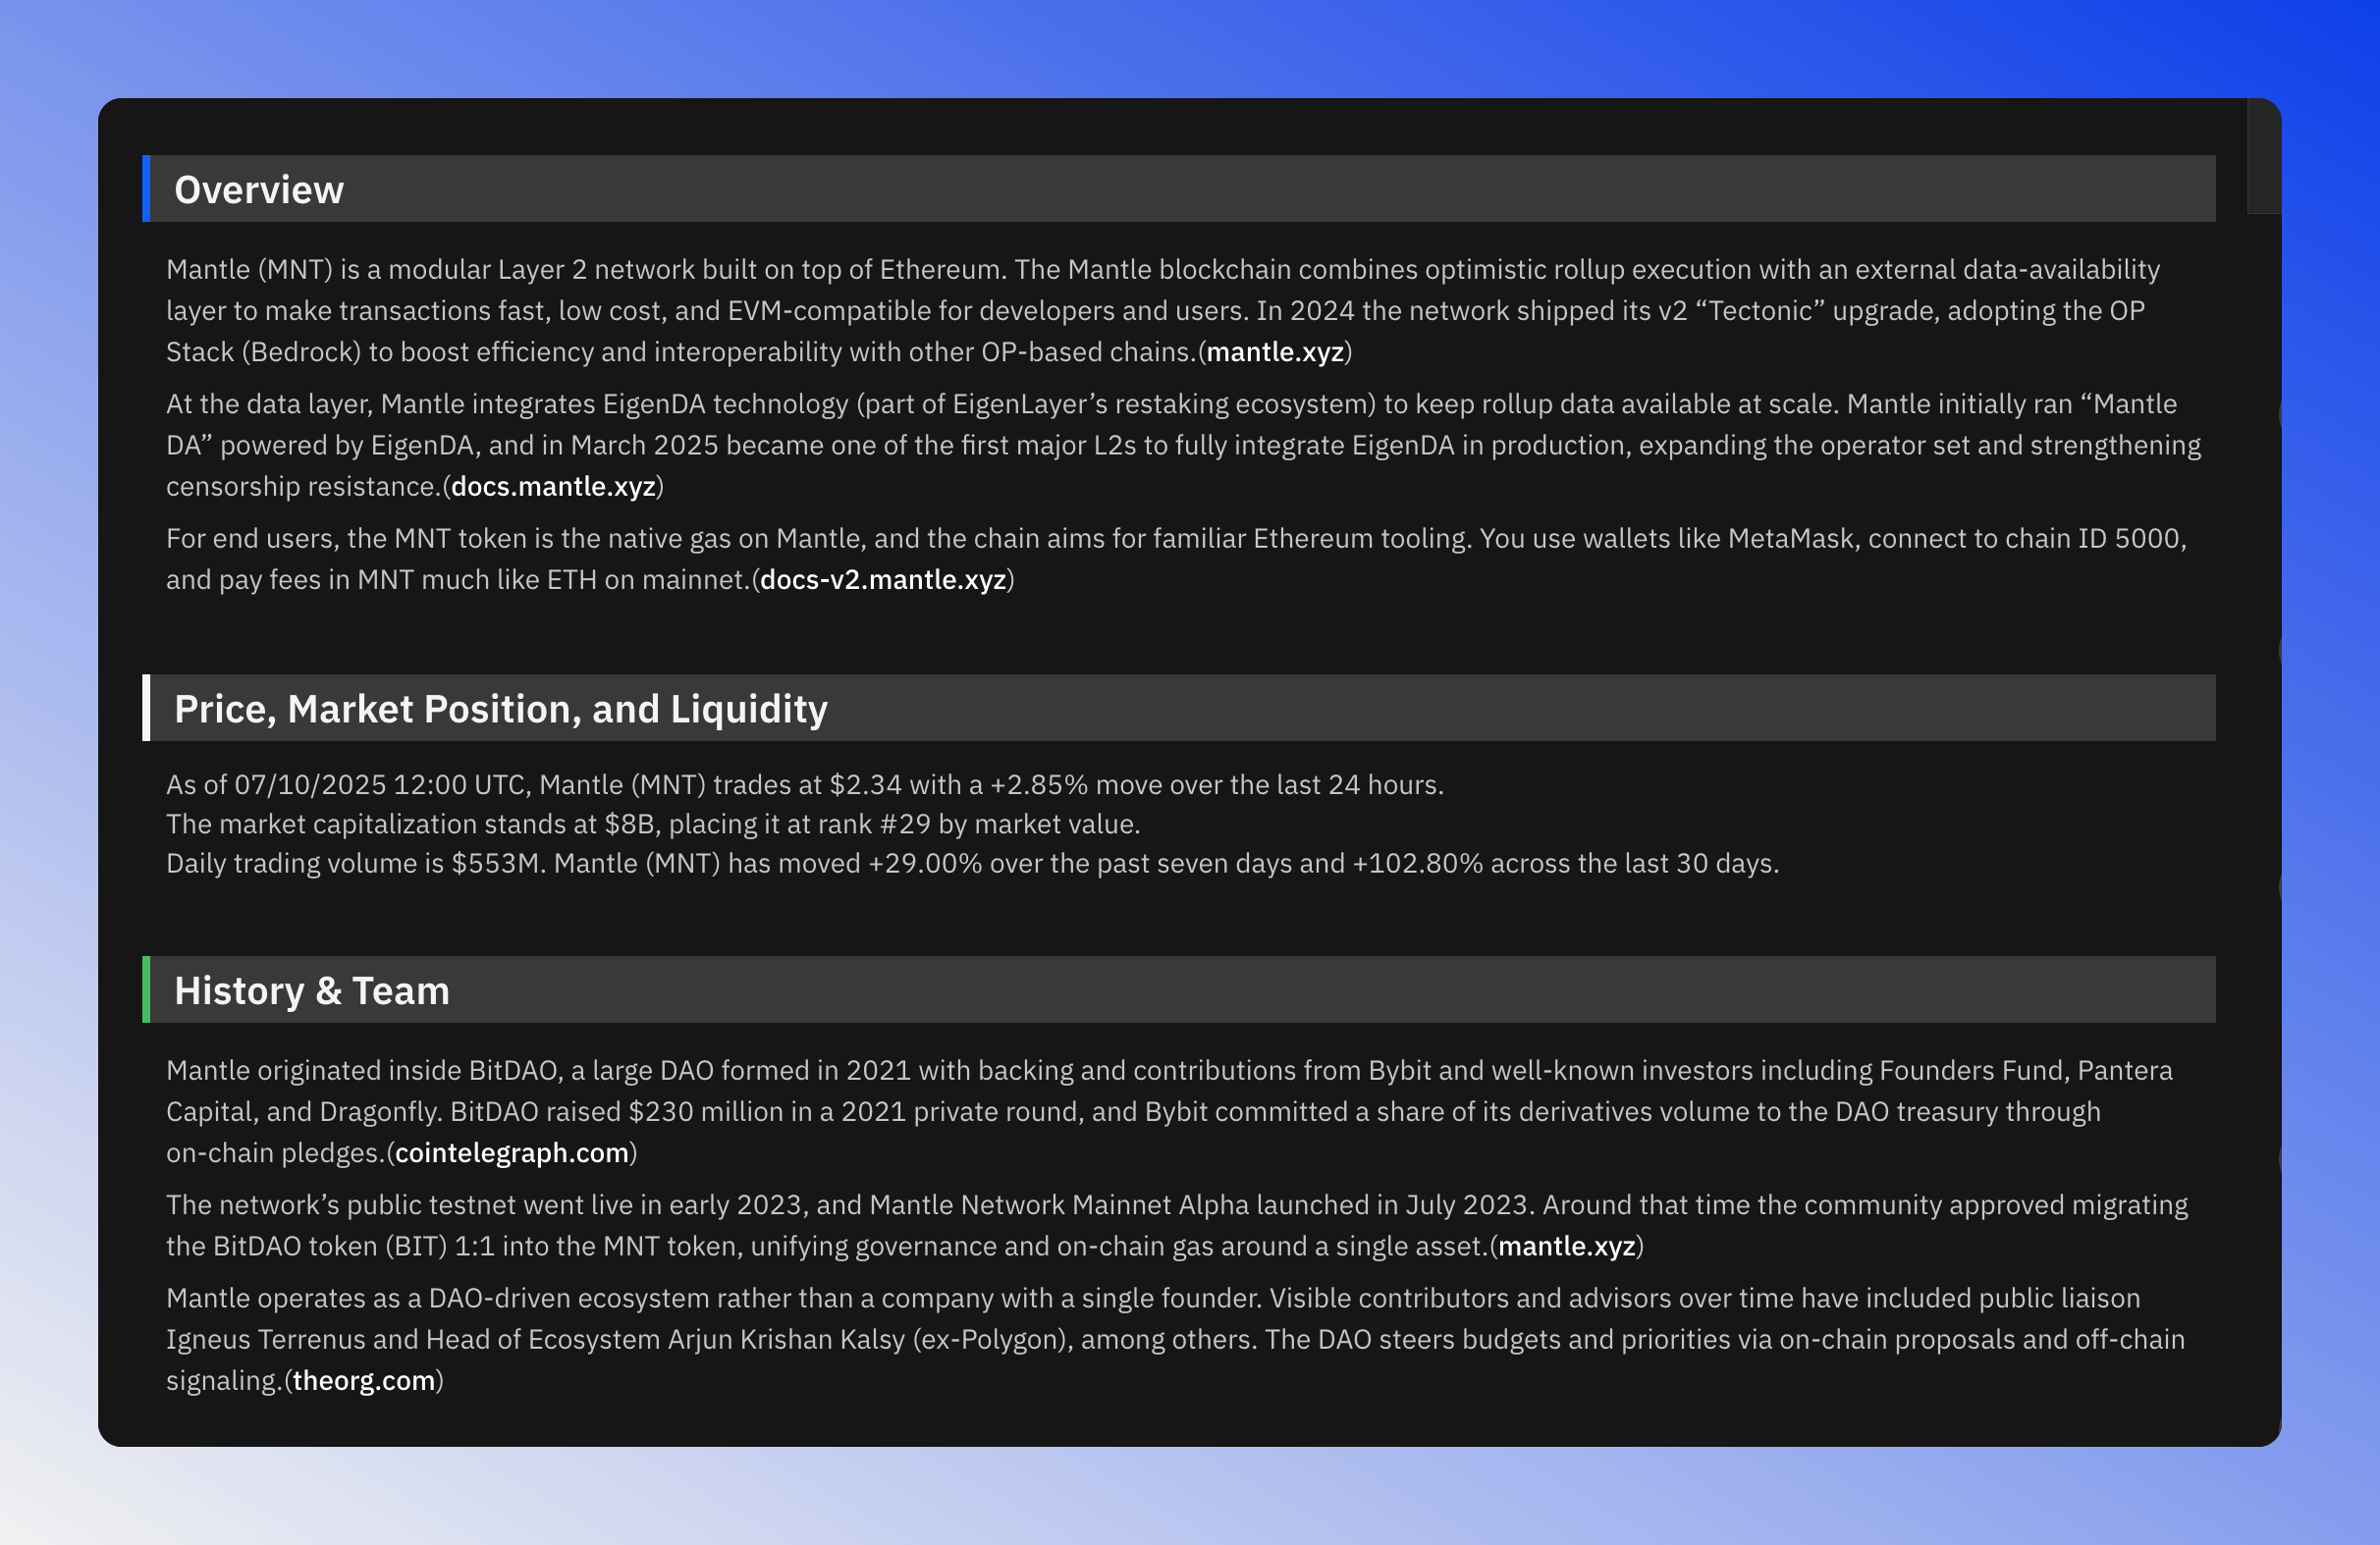
The Description section provides comprehensive, long-form content that goes far beyond basic summaries. Each token description is structured into detailed sections covering:
- Overview: Project fundamentals, architecture, and core technology
- Price & Market Position: Current pricing, market cap ranking, and liquidity metrics
- History & Team: Project origins, key milestones, and team background
- Technology & How It Works: Technical architecture, consensus mechanisms, and infrastructure details
- Tokenomics & Utility: Token supply, distribution, and use cases
- Ecosystem & Use Cases: Real-world applications, integrations, and DeFi/NFT ecosystem
- Advantages & Challenges: Competitive strengths and technical trade-offs
- Where to Buy & Wallets: Exchange listings and wallet compatibility
- Regulatory & Compliance: Legal status and compliance considerations
- Future Outlook: Roadmap, upcoming developments, and growth trajectory
These comprehensive descriptions give you everything you need to understand a token's fundamentals, technology, and market position in one place—perfect for research and due diligence.
Market Data
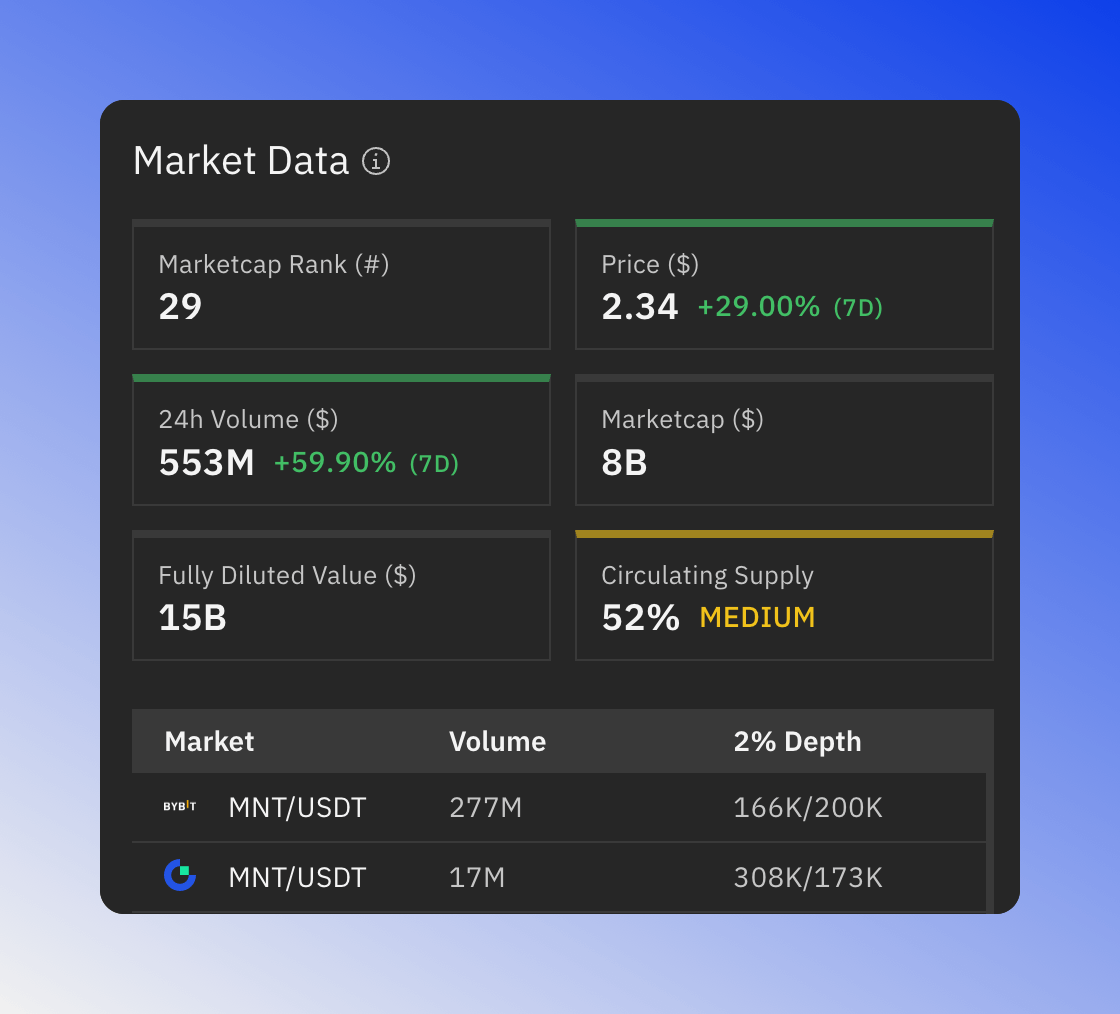
The Market Data tile highlights key metrics at a glance.
The tile now displays comprehensive market information including:
- Price: Current token price with 7-day percentage change
- Marketcap Rank: Token's ranking by market capitalization
- 24h Volume: Trading volume with 7-day percentage change
- Marketcap: Total market capitalization
- Fully Diluted Value (FDV): Maximum potential market cap
- Circulating Supply: Percentage of total supply in circulation with visual indicator (Low/Medium/High)
- Top Trading Pairs: Leading markets by volume with 2% depth metrics
The tile uses intelligent color coding to help you quickly assess market conditions:
- Green highlights indicate positive changes and strong metrics
- Red highlights indicate negative changes or concerns
- Yellow/Orange highlights indicate medium-level indicators
- Neutral (no color) indicates stable values or unavailable data
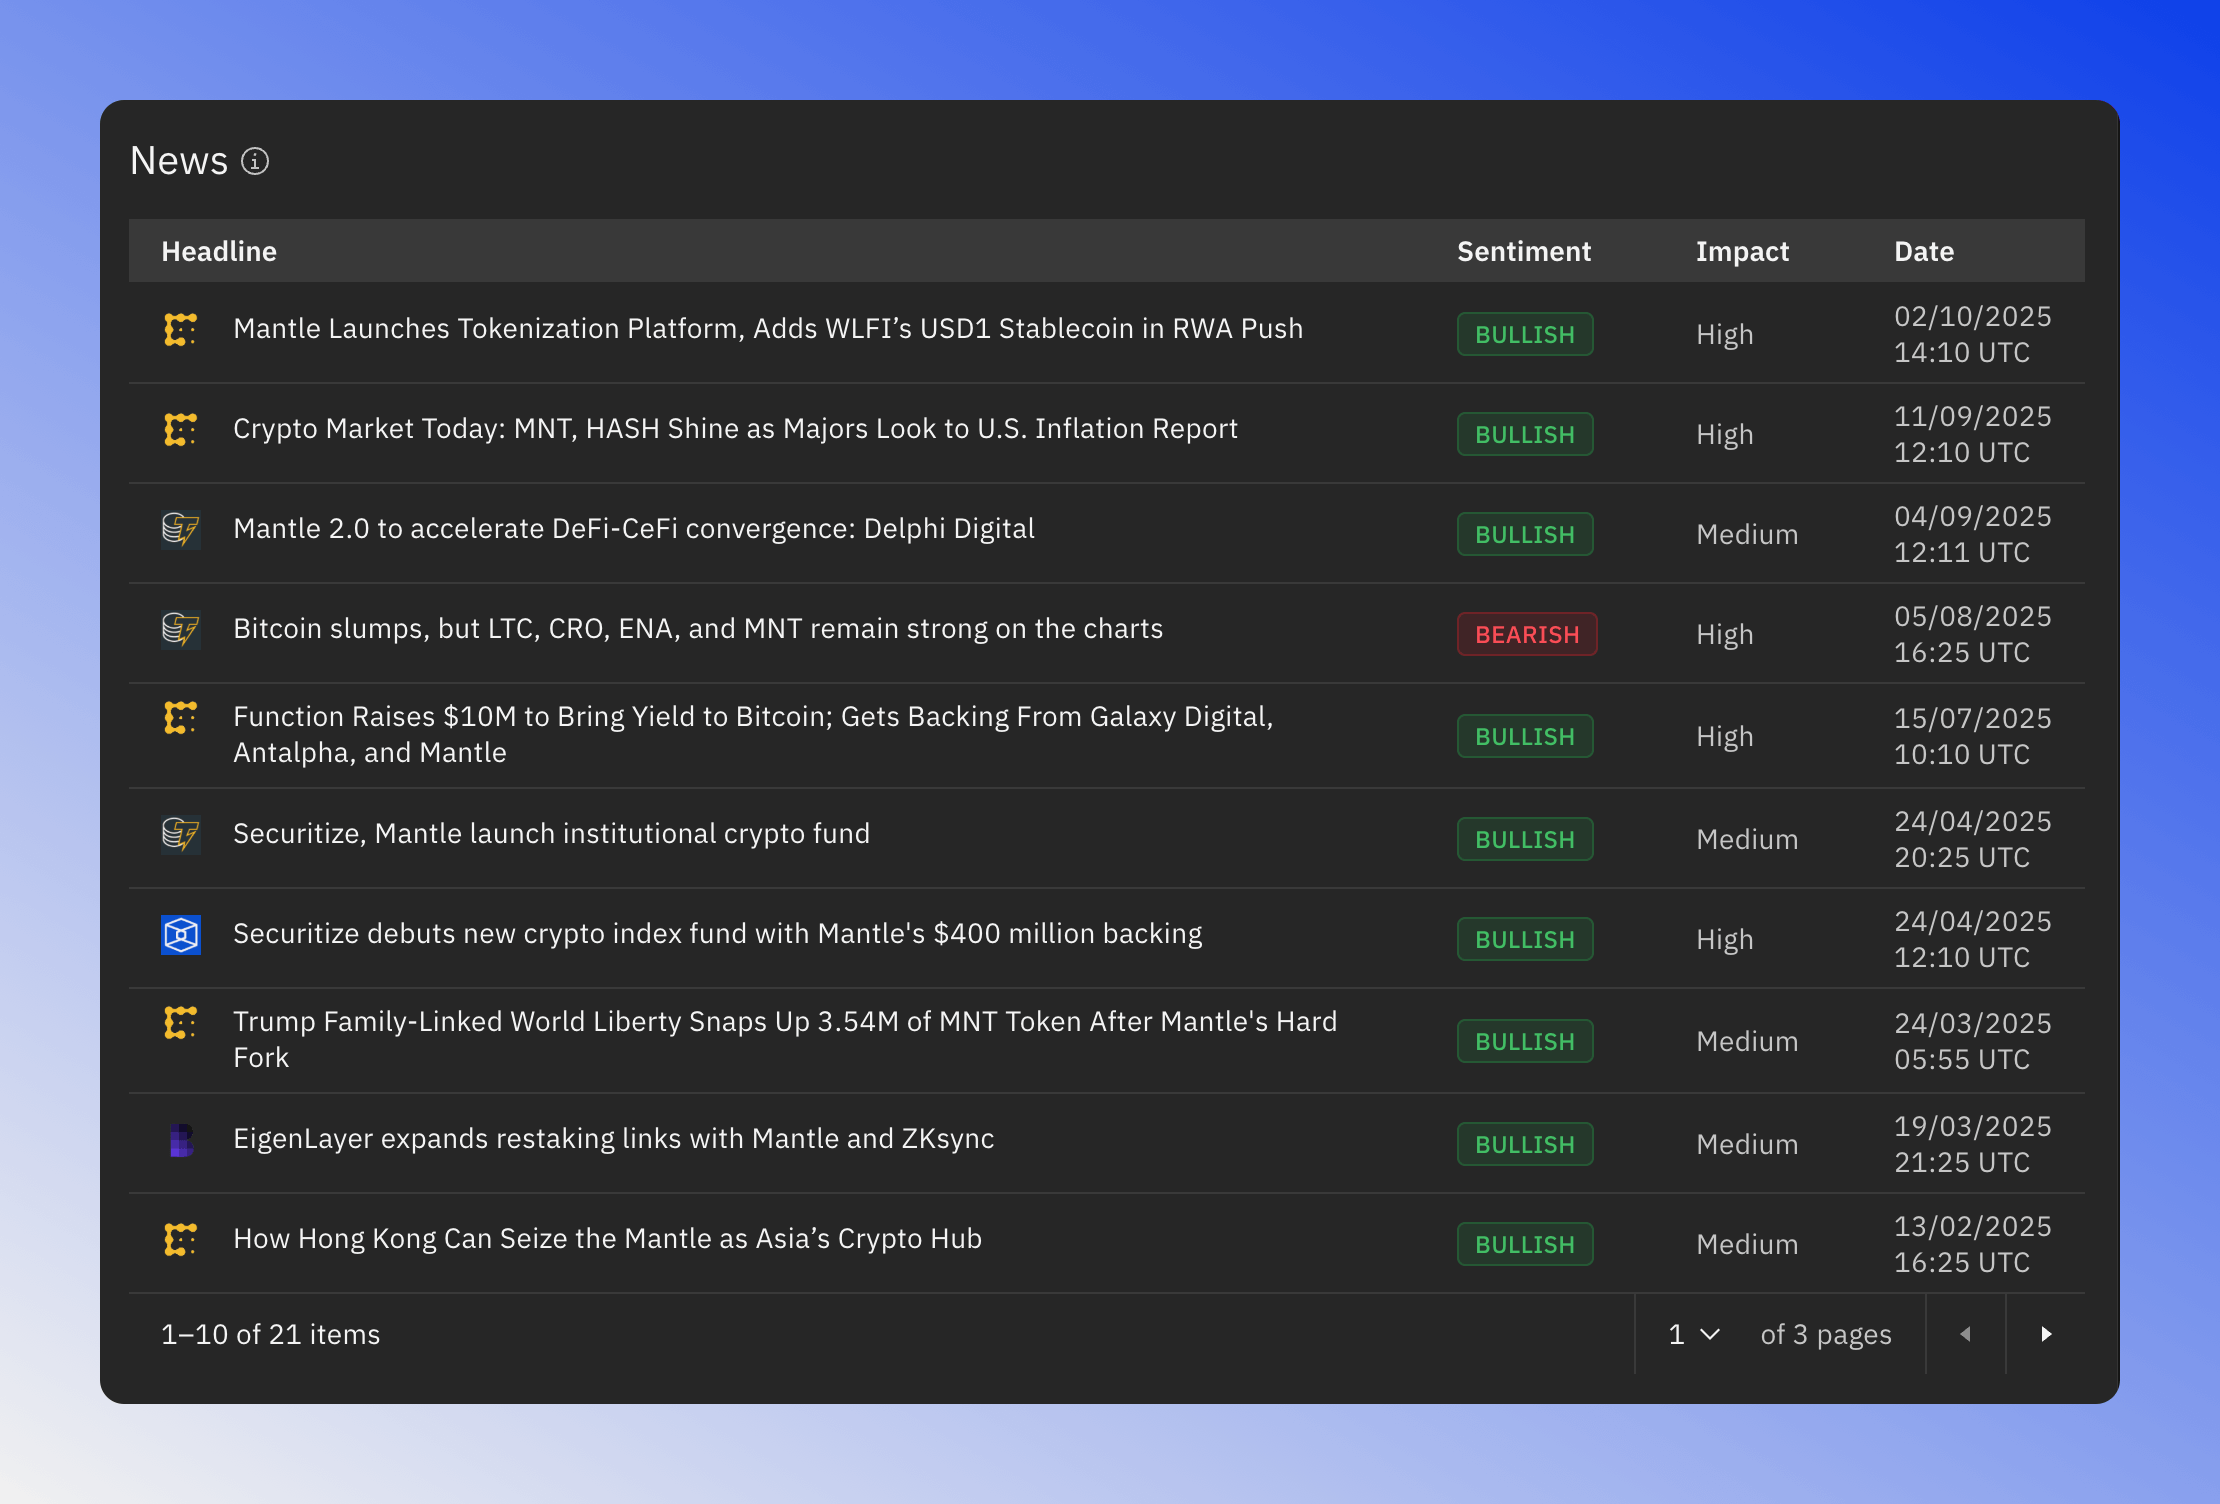
Latest News
Stay informed with the Latest News section, which aggregates relevant news and updates about the token. Each news item includes a sentiment indicator and impact assessment, helping you quickly gauge the potential significance of new developments.
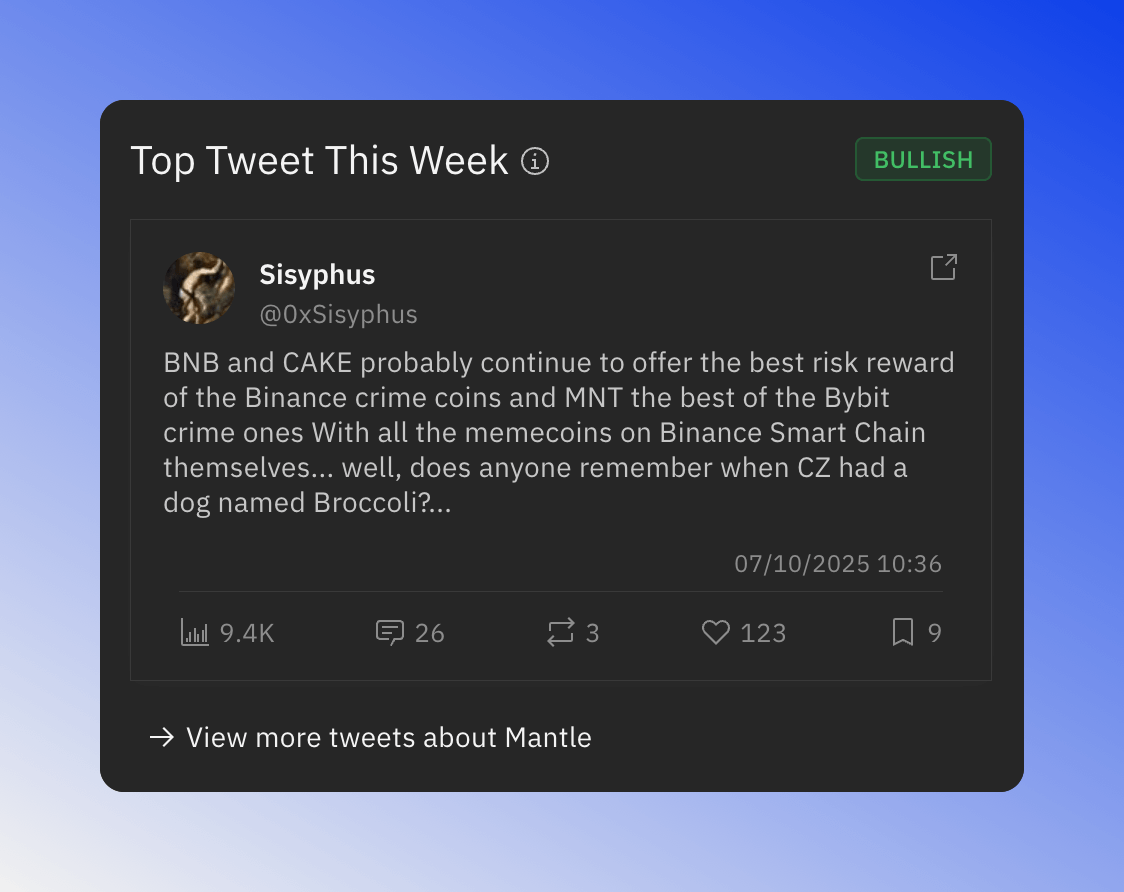
Top Token Tweets
Stay on top of social sentiment with the most impactful tweets about each token from the past week.
This feature surfaces the highest-quality, most-engaged tweet from the last 7 days, helping you:
- Gauge community sentiment with a quick sentiment indicator (Bullish/Bearish/Neutral)
- See what's trending through the most viral discussions and conversations
- Track engagement metrics including views, replies, retweets, likes, and bookmarks
- Access the full conversation with a direct link to view more tweets about the token
The algorithm prioritizes tweets based on quality signals and engagement levels, ensuring you see the most relevant and impactful social commentary—not just the noisiest.
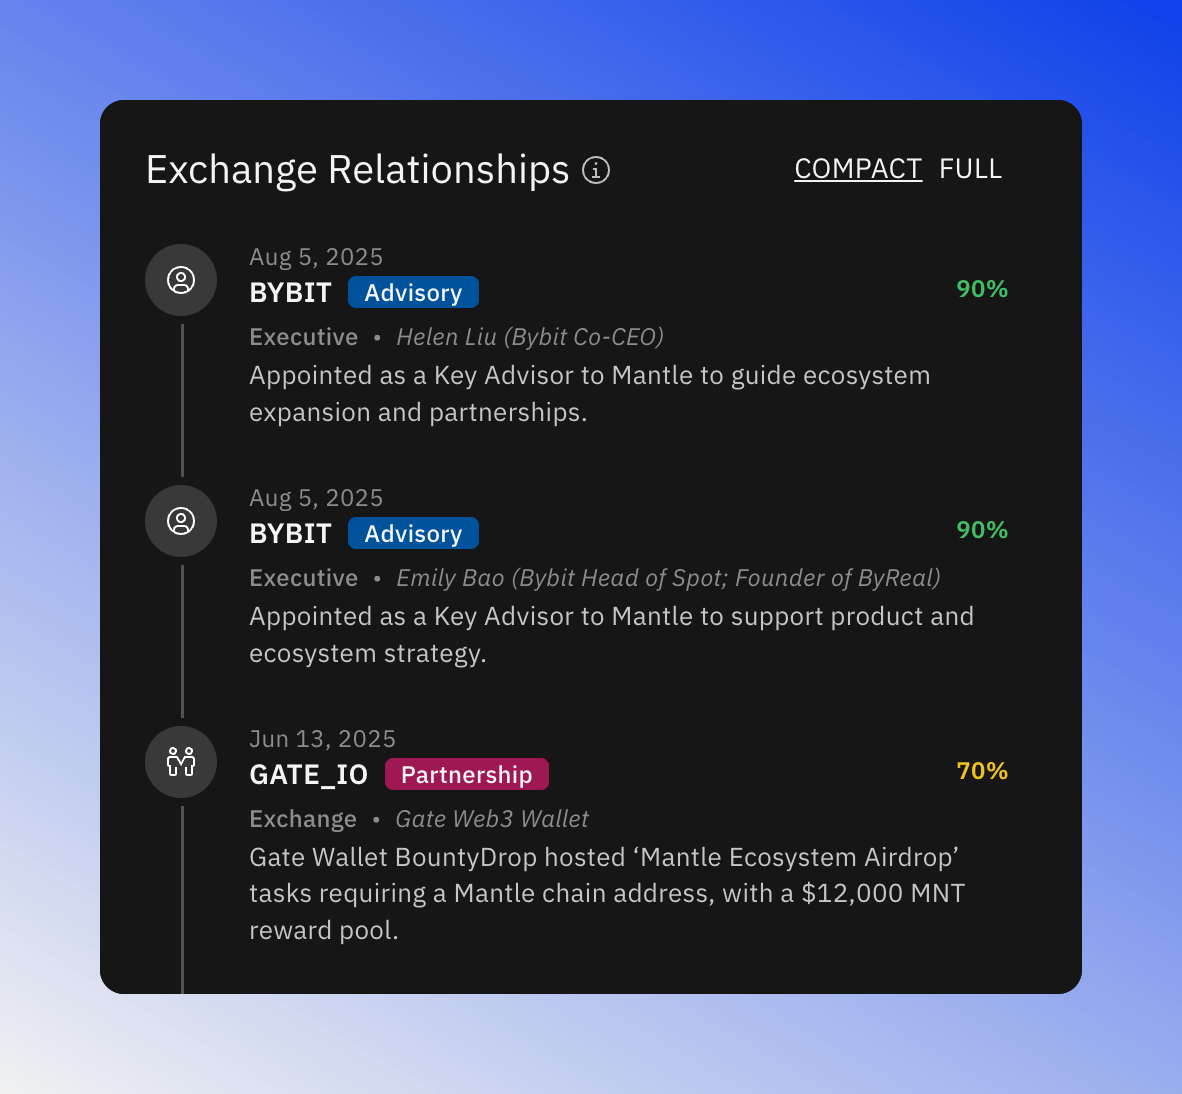
Exchange Relationships
Exchanges play a vital role in the crypto ecosystem, and tracking their moves is important. This interactive timeline shows key relationships between exchanges and the token, helping you understand partnership dynamics and exchange activity.
The timeline displays:
- Chronological events showing when exchanges formed relationships with the token
- Relationship types including Advisory roles, Partnerships, Listings, and more
- Key personnel involved in each relationship with their roles and affiliations
- Event descriptions explaining the nature and impact of each relationship
- Sentiment scores indicating the strength or importance of each relationship (shown as percentages)
- Compact/Full view toggle to show more or fewer details based on your needs
This feature gives you crucial insights into institutional support, exchange adoption milestones, and strategic partnerships that can influence a token's trajectory and market presence.
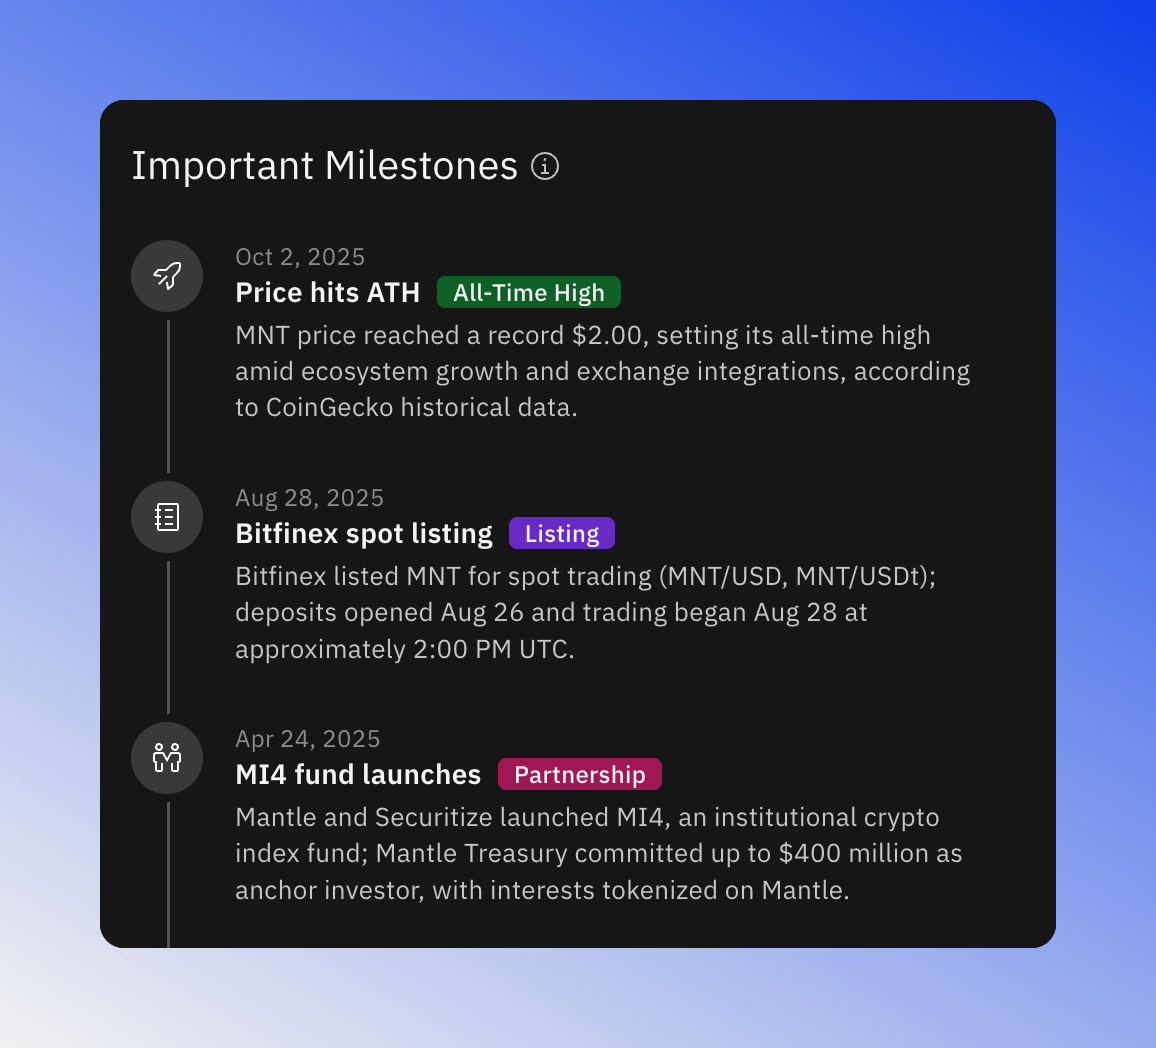
Important Milestones
Track a token's journey through key historical events and achievements with a comprehensive milestones timeline.
This feature displays significant events in the token's history, including:
- Price milestones: All-time highs, all-time lows, and other significant price levels
- Exchange listings: When and where the token was listed for trading
- Partnerships: Strategic collaborations and institutional relationships
- Funding rounds: Investment events and treasury commitments
- Technical upgrades: Major protocol updates and network improvements
- Product launches: New features, services, or ecosystem developments
Each milestone is:
- Categorized by type with color-coded badges (All-Time High, Listing, Partnership, etc.)
- Displayed chronologically in an easy-to-follow timeline format
- Marked with icons indicating the milestone category at a glance
- Rich with details including dates, specific events, and contextual information
This historical perspective helps you understand the token's development trajectory, adoption progress, and key turning points in its evolution.