Token Social Insights
The Token Social Insights page provides real-time insights into market sentiment and the latest social media posts about a token. This powerful tool combines multiple data points to give you a comprehensive view of how the community...
 Written by taika · Creator of Token Radar
 The Token Social Insights page provides real-time insights into market sentiment and the latest social media posts about a token.
This powerful tool combines multiple data points to give you a comprehensive view of how the community feels about a particular token.
Sentiment Chart
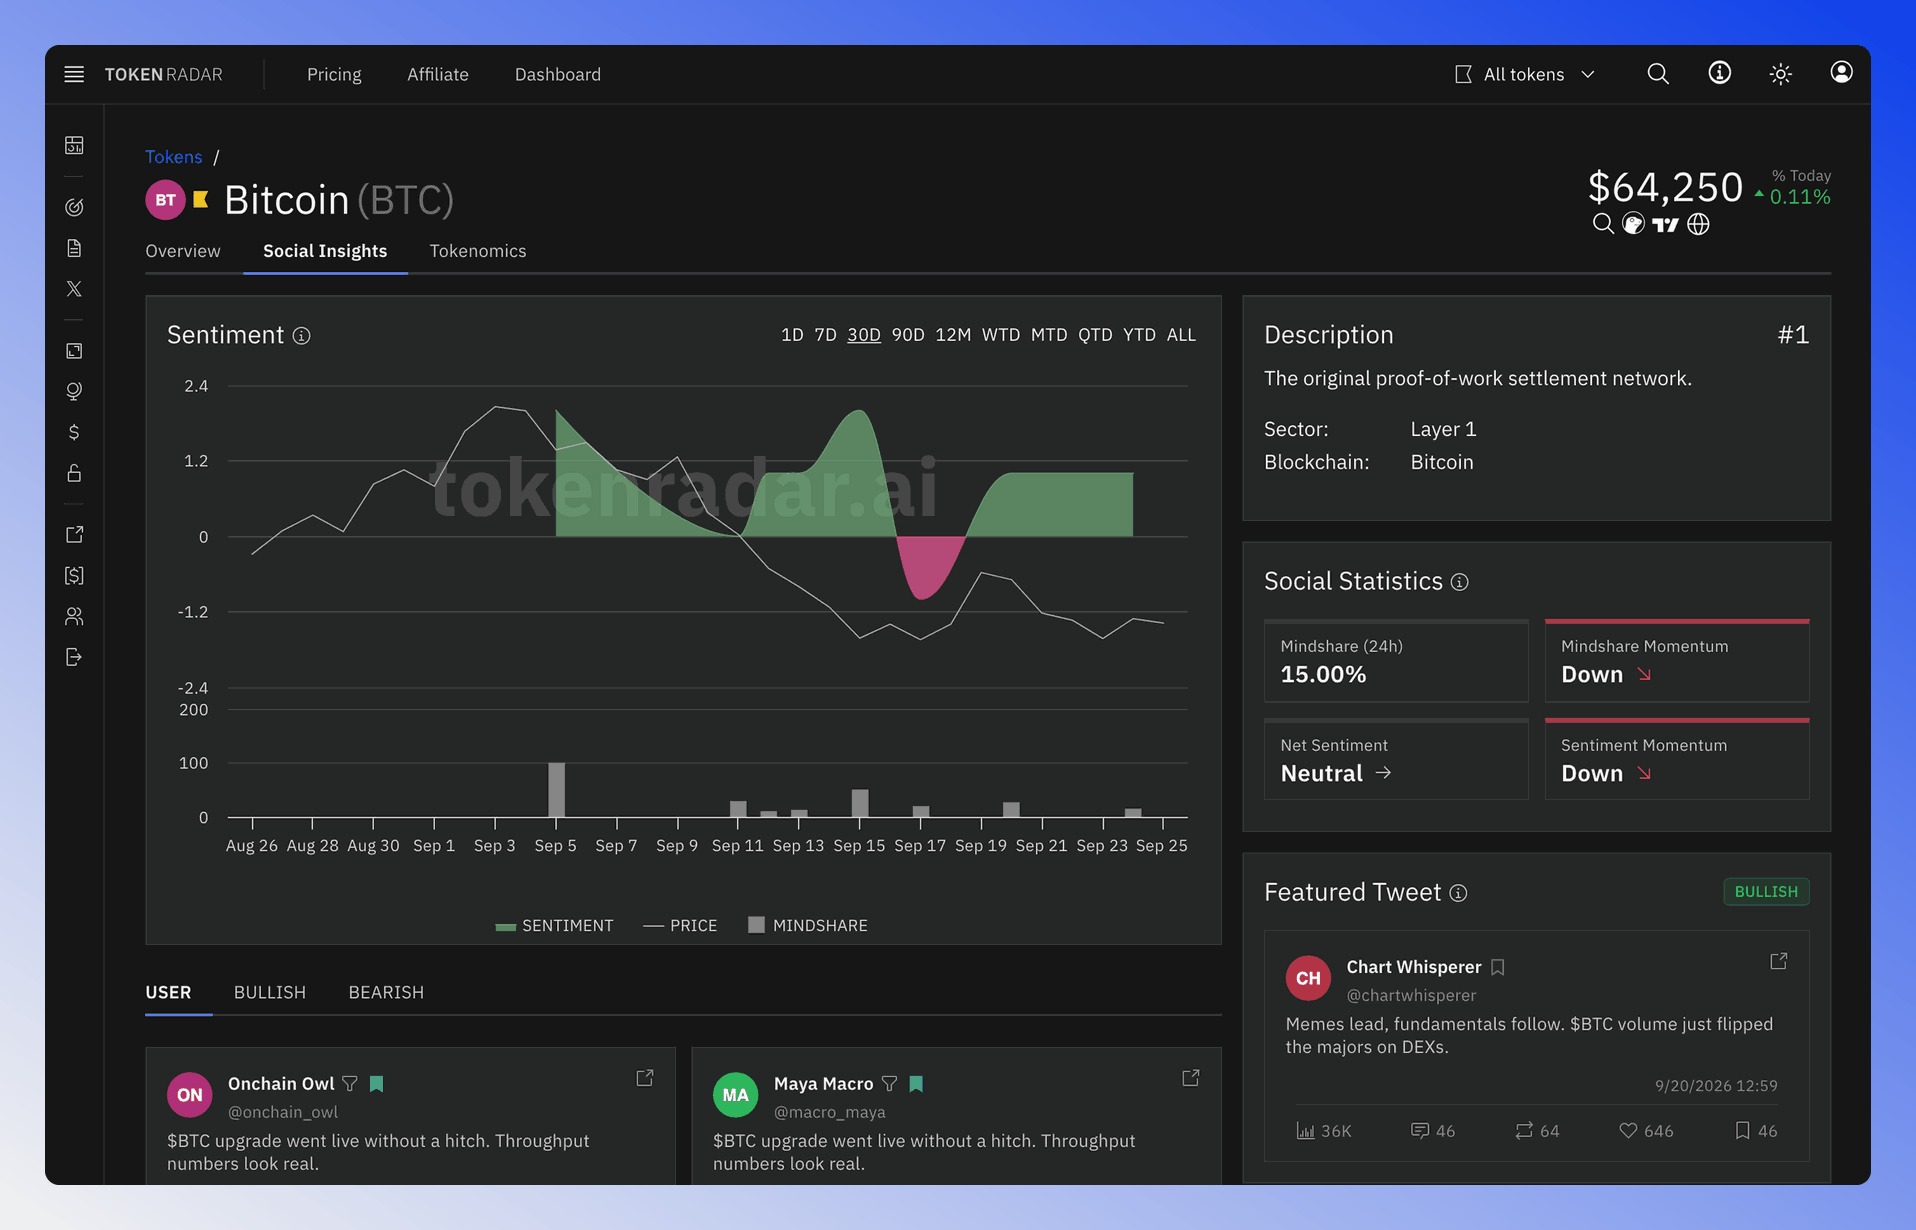
The sentiment graph displays a dynamic visualization of token sentiment over time:
- Green areas indicate positive sentiment
- Red areas indicate negative sentiment
- The graph is overlaid with the token's price movement, allowing you to correlate sentiment shifts with price action
- A volume histogram shows the mindshare (social activity) for each period
Social Statistics
The platform provides key social metrics:
- Mindshare (24h): Percentage of social discussions focused on the token
- Mindshare Momentum: Direction of change in social attention (Up/Down)
- Net Sentiment: Overall community sentiment (Bullish/Bearish/Neutral), based on the difference between positive and negative mentions
- Sentiment Momentum: Direction of sentiment movement (Up/Down)
Social Posts Grid
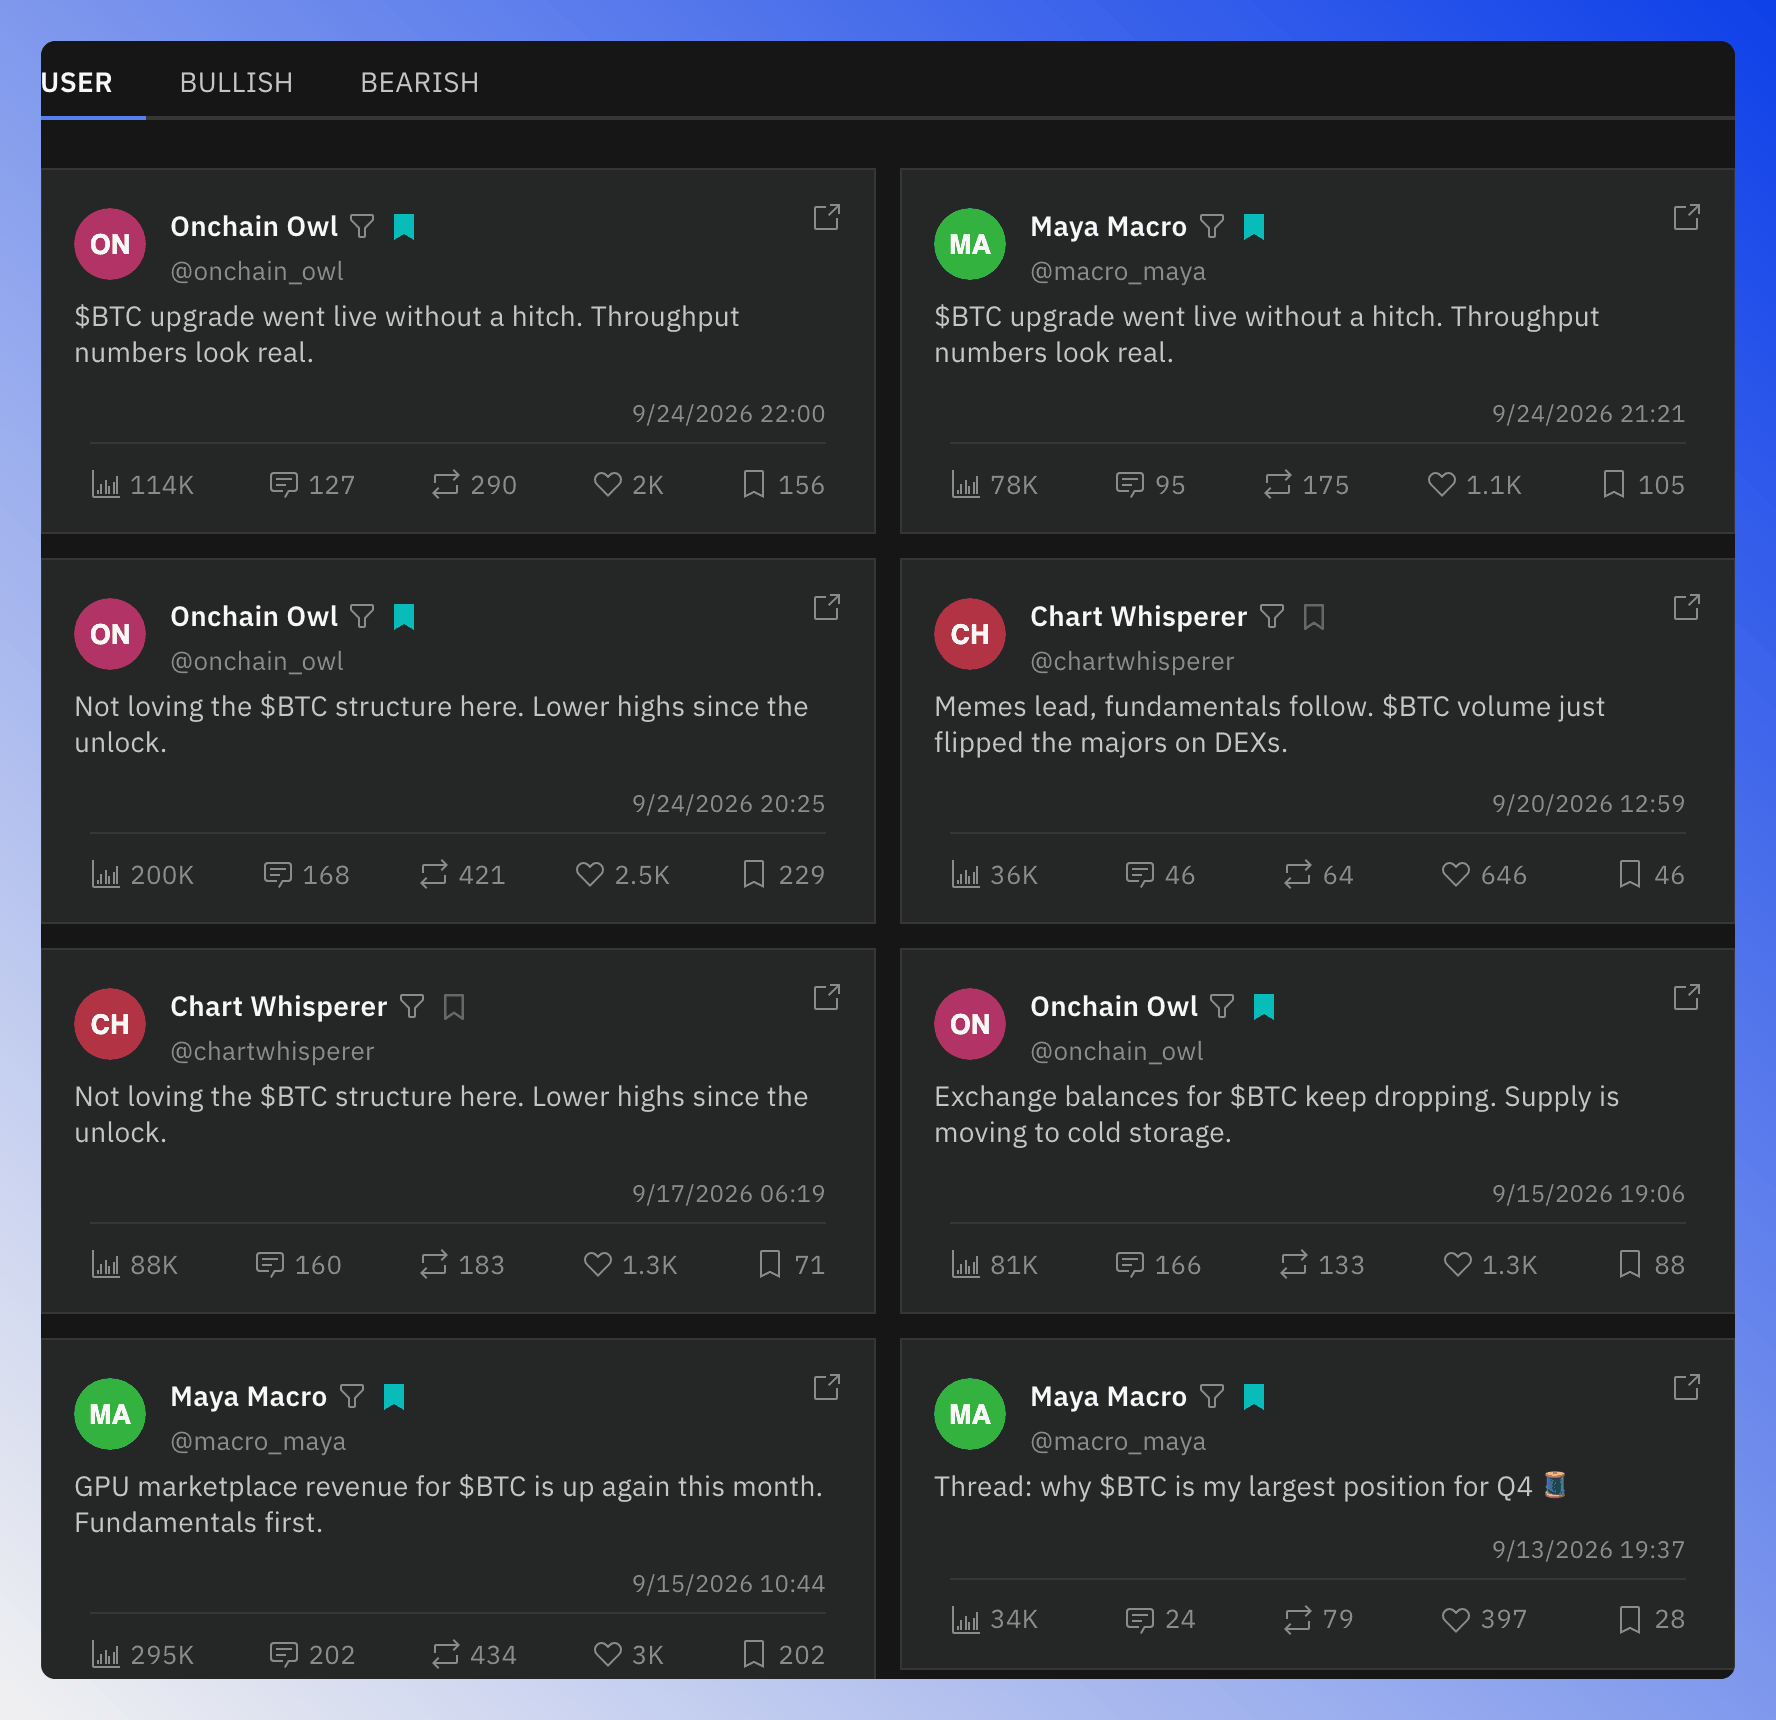
The social posts grid displays the latest social media posts about the token. The USER tab shows posts by personal accounts, and an OFFICIAL tab appears when the project's own accounts posted about the token. The tabs BULLISH, BEARISH, and NEUTRAL filter the user posts by sentiment and appear when there are posts with that sentiment.