
Token News Mentions
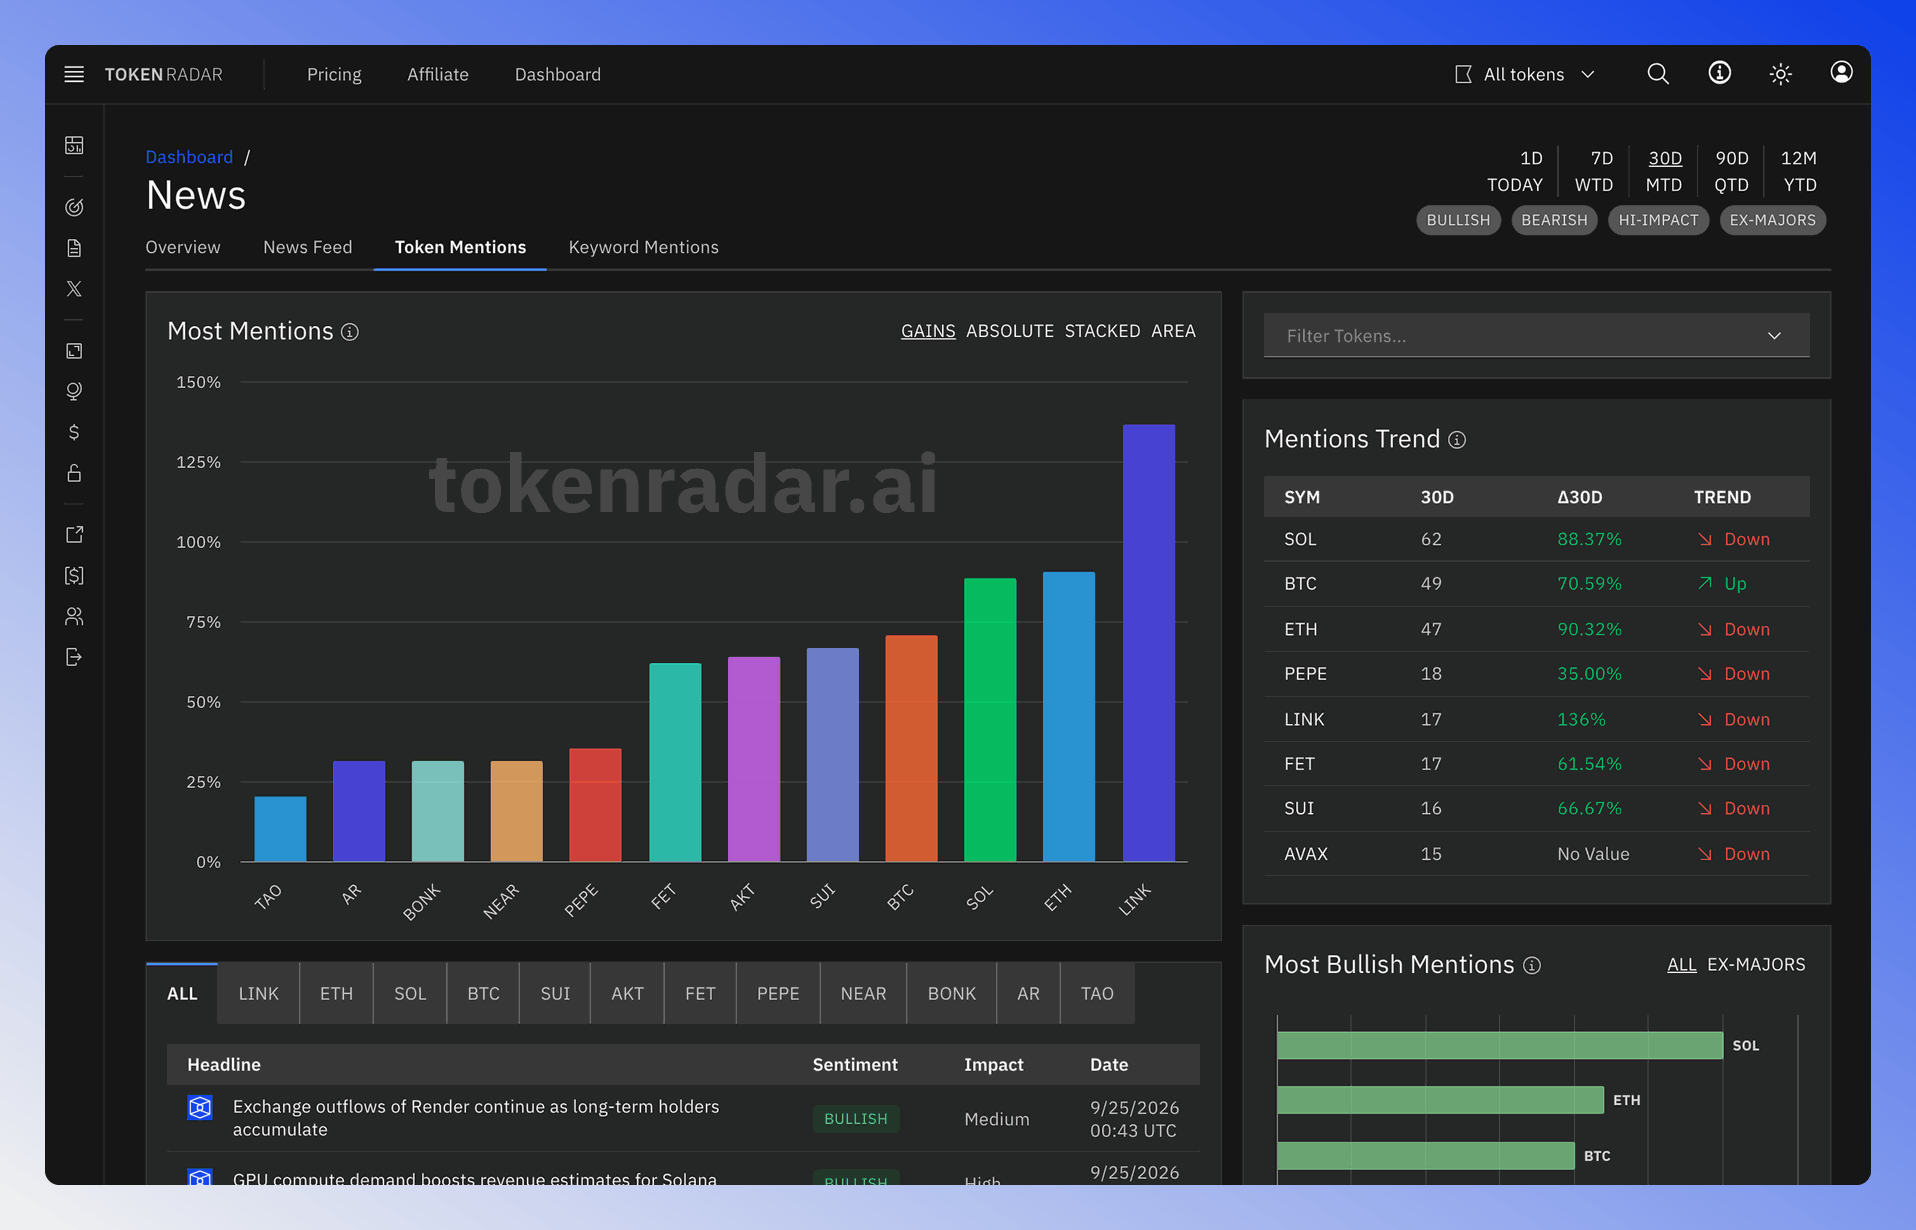
The Token Mentions page tracks how often tokens appear in news articles. Interactive charts and customizable filters help you spot trends and market sentiment patterns.
Main Filter
The main time and filter settings on the top right of the news page can be used to adjust the time and filter settings of the whole page.
- BULLISH: Shows only bullish/positive news articles
- BEARISH: Shows only bearish/negative news articles
- HI-IMPACT: Displays news with significant market impact
- EX-MAJORS: Excludes news about major cryptocurrencies (BTC, ETH, etc.)
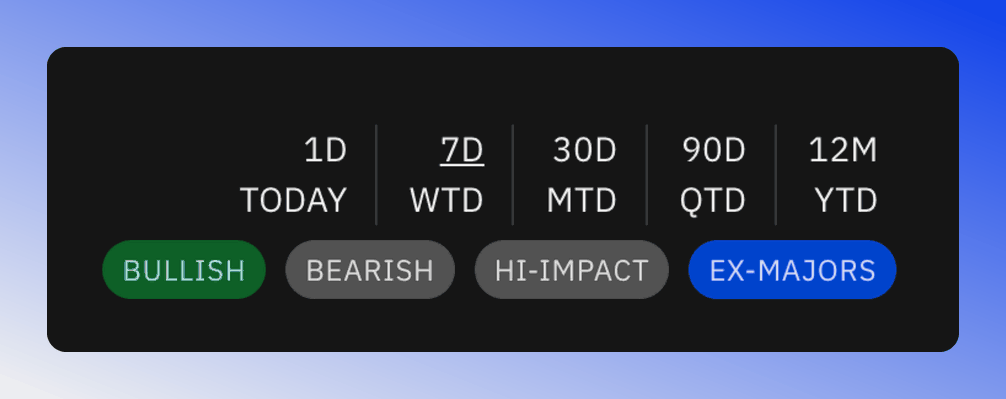
News time and filter settings.
Mentions Chart
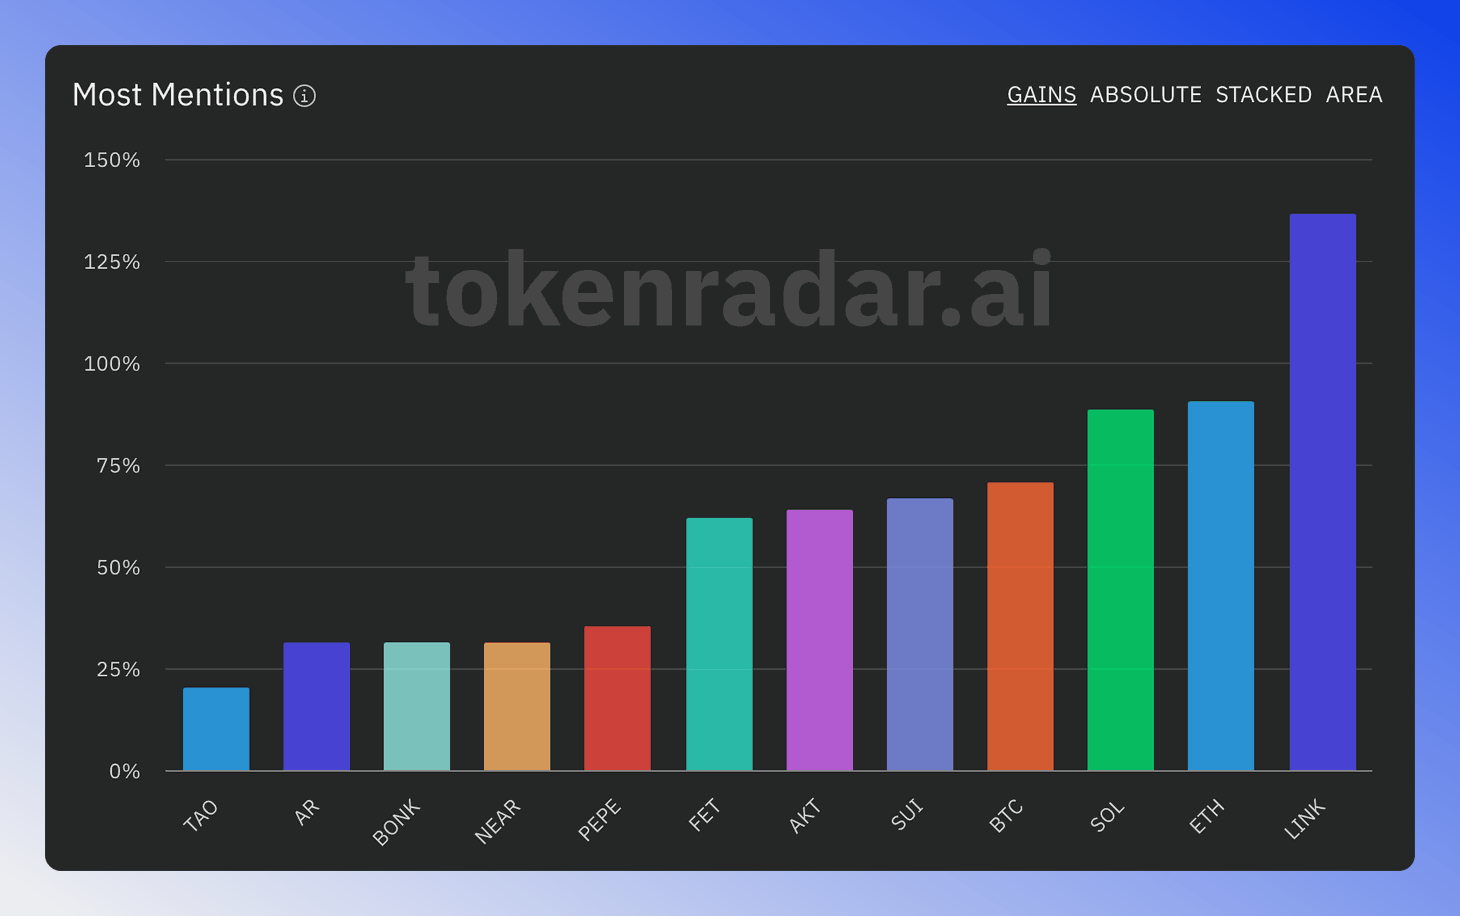
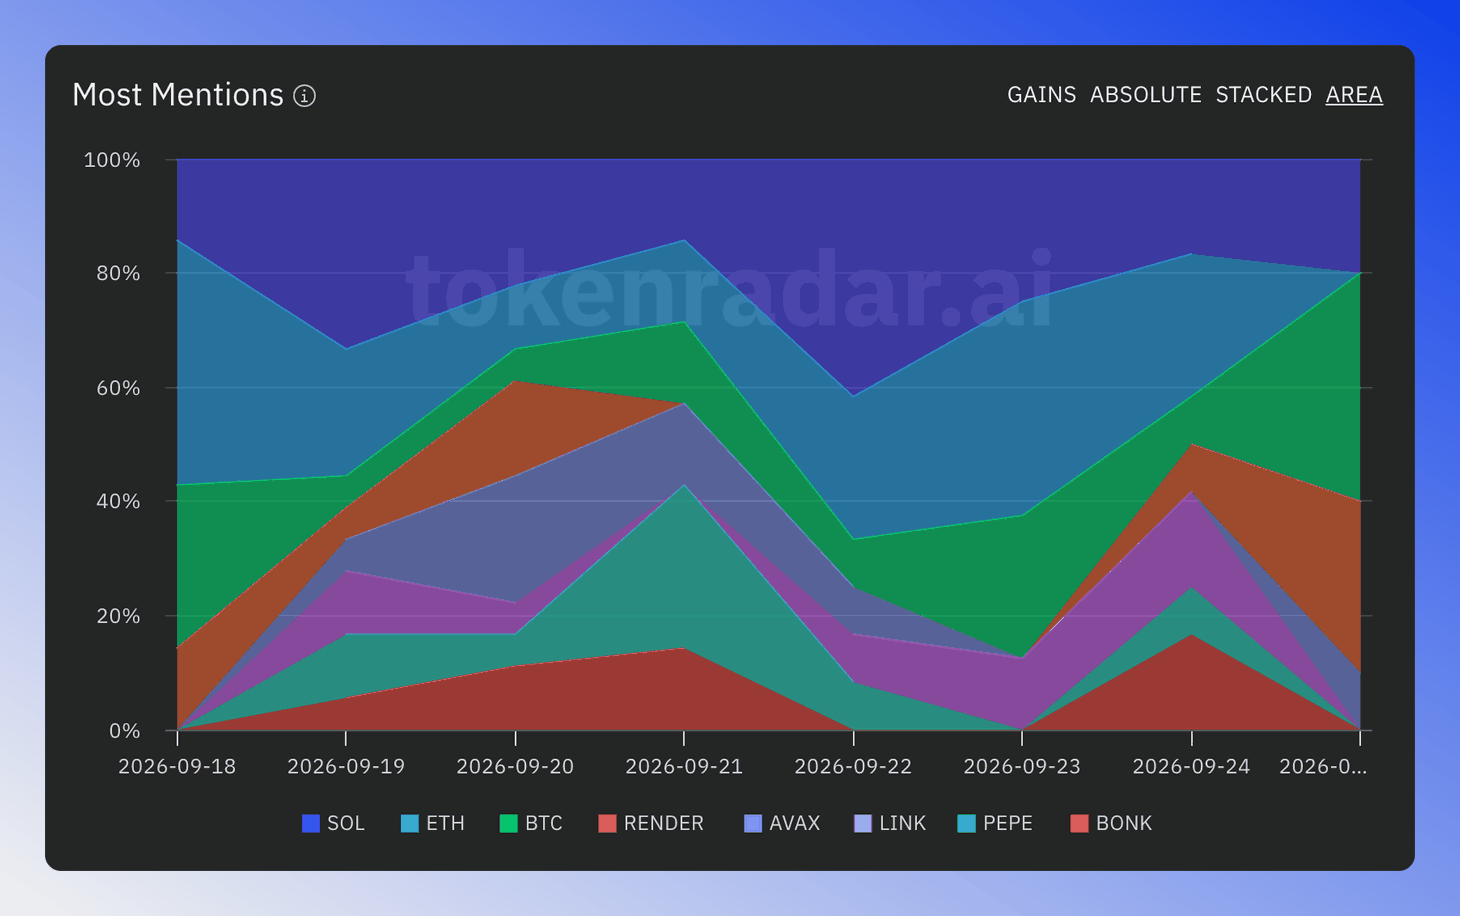
The Most Mentions Chart displays token mention frequency in news articles. Each color represents a different token (BTC, ETH, SOL, etc.), allowing you to compare media coverage across cryptocurrencies. Use GAINS, ABSOLUTE, STACKED and AREA at the top of the chart to switch between the views, and the Filter Tokens menu next to the chart to pick the tokens to compare.
Gains and Absolute Charts
Both views show tokens as individual bars for easy comparison. GAINS, the default, ranks tokens by the percentage change of their 50-day average mention count over the selected time period, so tokens with rising coverage stand out. ABSOLUTE shows the number of mentions. Use "EX-MAJORS" filter to discover trending non-major tokens.
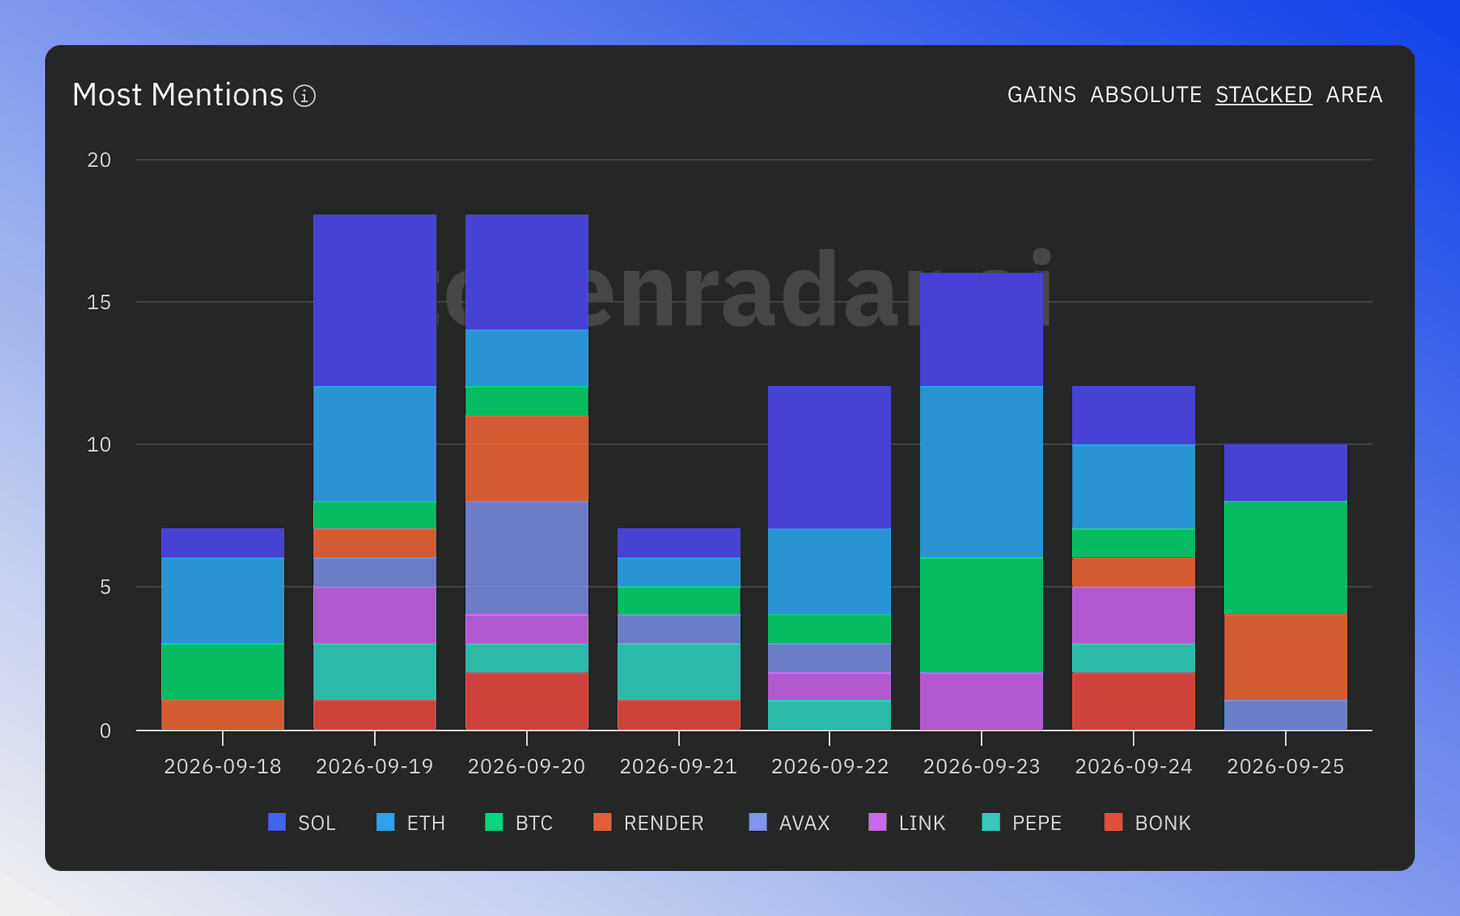
Stacked Chart
Shows all tokens combined in one bar, revealing overall mention patterns across time periods.
Area Chart
Shows mentions as flowing curves - perfect for comparing trends between similar or competing tokens over time.
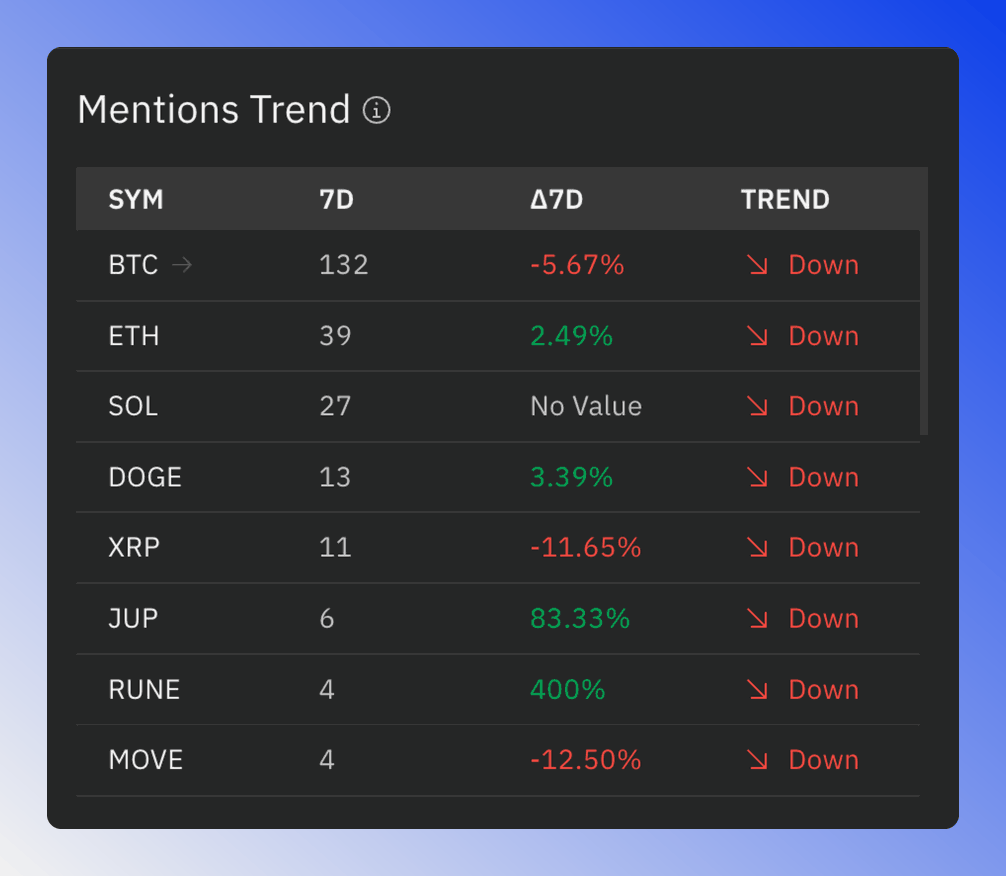
Mentions Trend Table
The Mentions Trend table shows how many token mentions in news articles occurred during the selected timespan, the percentage change over the selected time period, and the trend indicates if the mentions count is rising or falling.
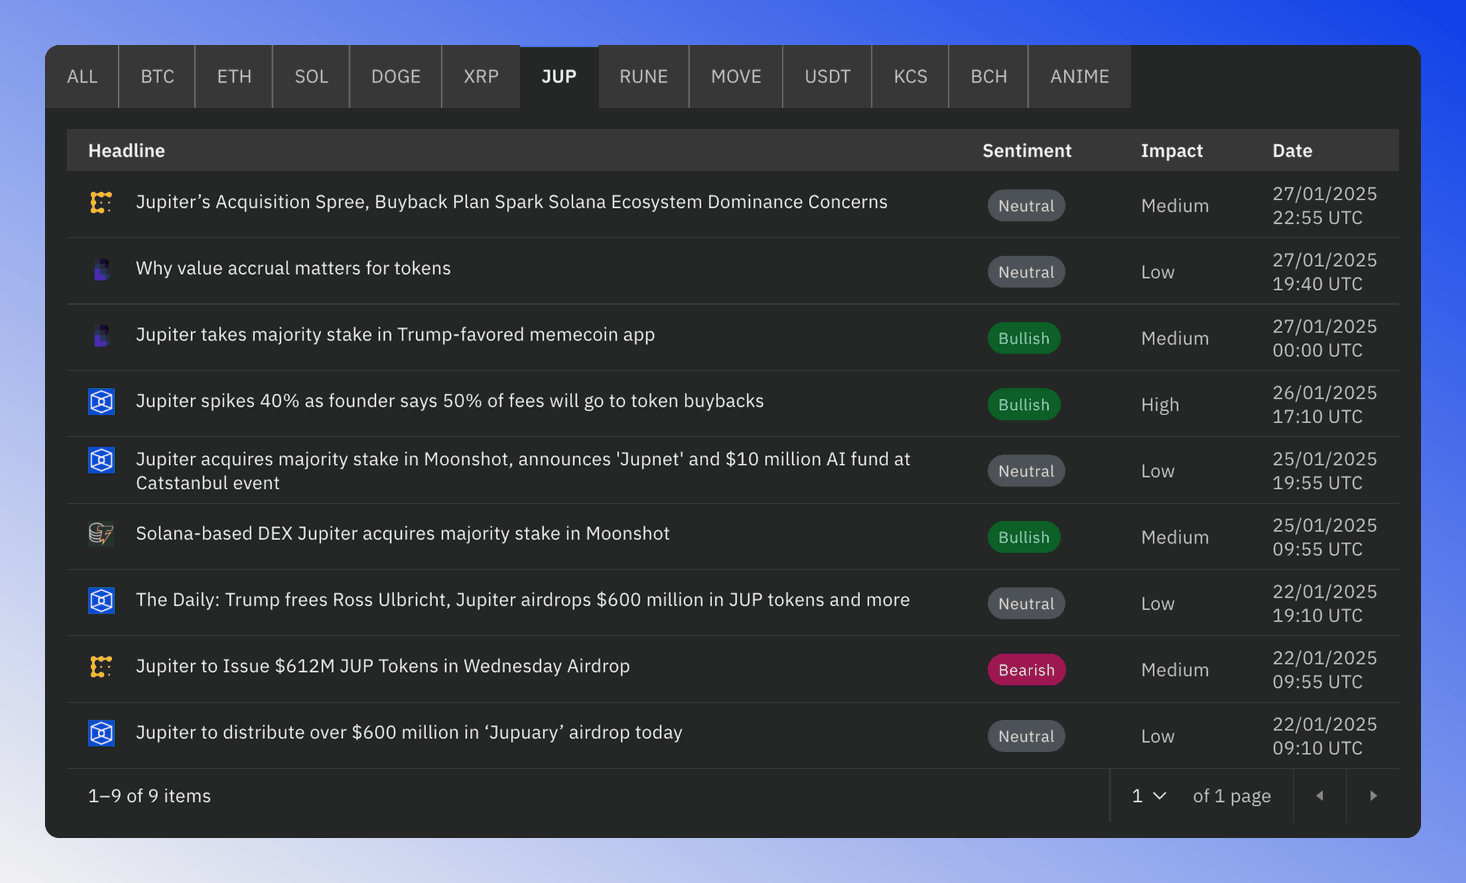
News Table
The News Table shows the news of the twelve most mentioned tokens. The ALL tab lists the news of all these tokens, and each token has its own separate tab. The token selection is dependent on the main filter settings.
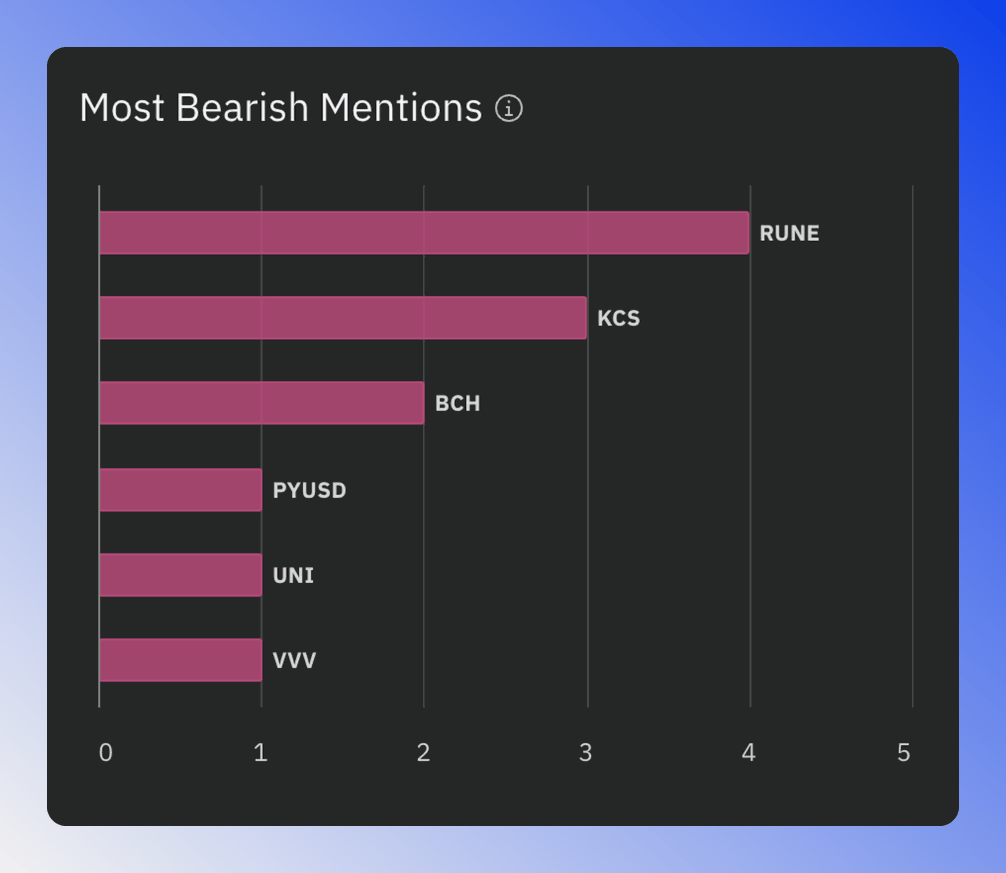
Most Bullish and Bearish Chart
The most bullish and most bearish chart shows which six tokens had the most bullish or bearish mentions over the selected time period.
Price Preview Charts
At the bottom of the page, small price charts show the recent price movements of the most discussed tokens. A chart turns green when the token trades above its 10- and 50-day moving averages, indicating a bullish trend.