Release 26.1
This release brings candlestick charts, moving-average overlays, and more tools for researching tokens and their markets.
Highlights
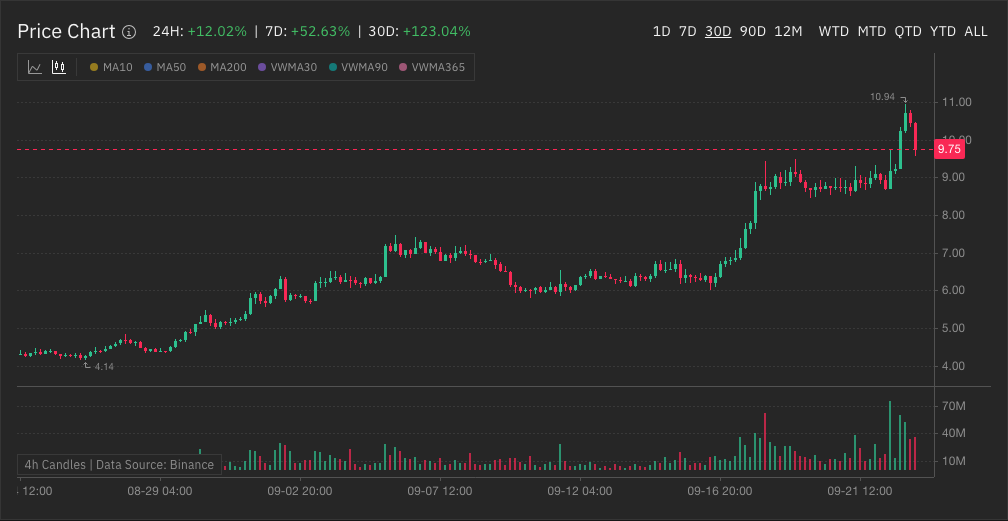
- Candlestick Charts: Explore price action and trading volume with our new candlestick view
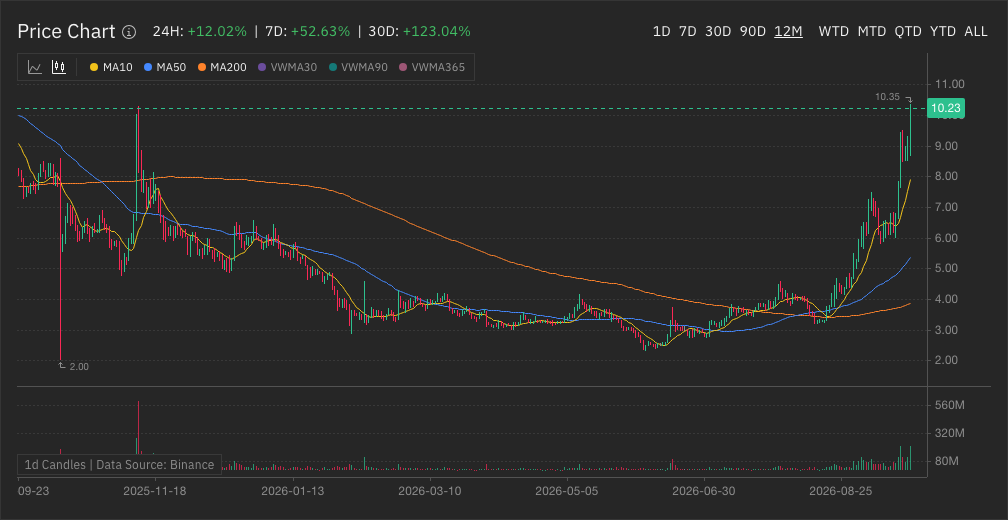
- Moving-Average Overlays: Compare price with short- and long-term trends directly on the chart
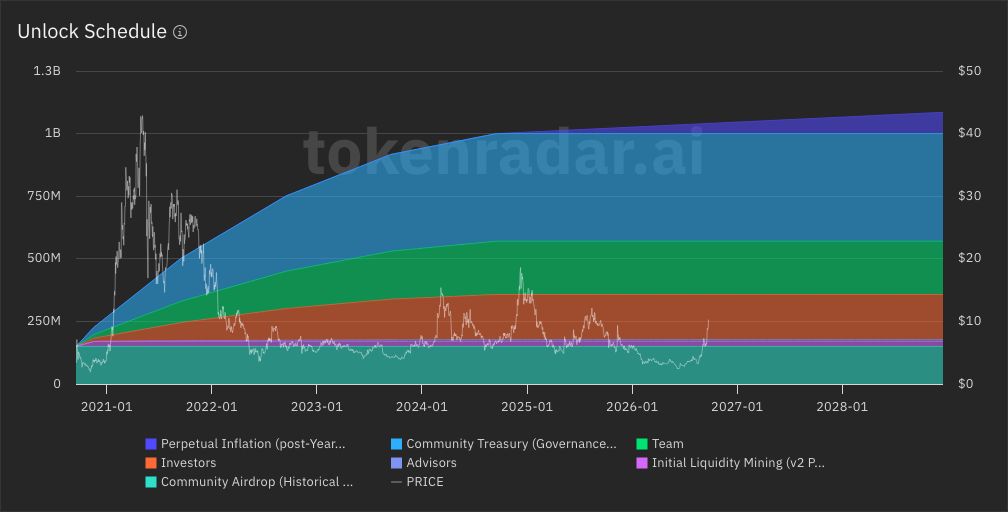
- Tokenomics: Explore token allocations, vesting schedules, and supply unlocks
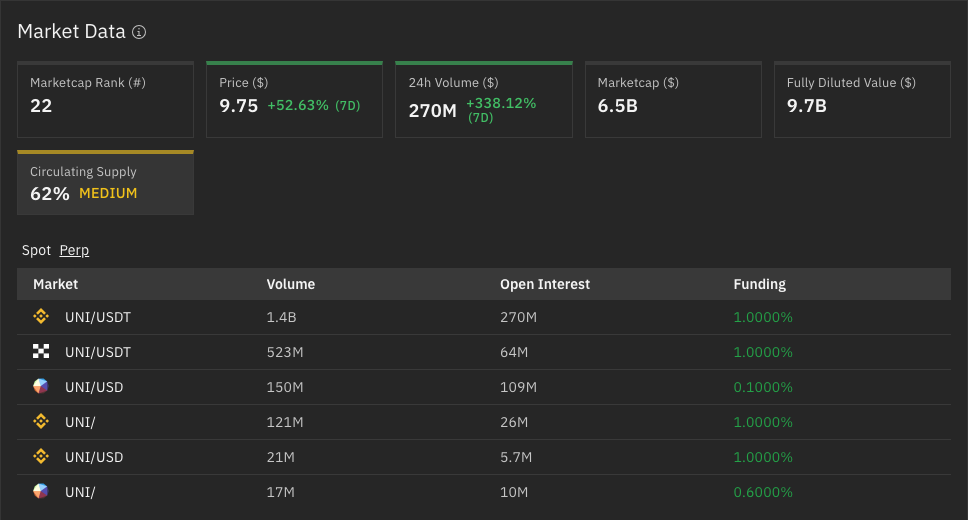
- Perpetual Markets: Compare trading volume, open interest, and funding rates
Candlestick Charts
Token pages now feature interactive candlestick charts. Each candle shows the opening, highest, lowest, and closing price for its period, with trading volume below the chart.
- Switch Views: Move between candlestick and line charts, with your preference remembered
- Explore Price Action: Zoom, pan, and hover to inspect individual candles and volume
- Automatic Intervals: Candle intervals adapt to the selected timeframe, from 15-minute candles for a daily view to weekly candles for the full history
- Clear Data Labels: See the candle interval, data source, and when available history begins
Candlesticks are the default where candle data is available. Tokens without candle data continue to use the line chart, and historical coverage varies by token and source.
Moving-Average Overlays
You can now add moving averages directly to both chart views to put price movements in context:
- MA10, MA50, and MA200: Follow the 10-, 50-, and 200-day average price
- VWMA30, VWMA90, and VWMA365: See volume-weighted average prices over 30, 90, and 365 days
Toggle each line on or off using the chart controls. The averages always use daily data, so a 50-day average stays a 50-day average when you change the chart timeframe. Availability depends on the selected range and the token's history.
Tokenomics and Unlock Schedules
The Tokenomics tab brings supply information together in one place. For tokens with available data, you can explore:
- Unlock and Vesting Charts: See how token supply is scheduled to enter circulation
- Allocation Breakdowns: Understand how supply is divided among teams, investors, and the community
- Token Utility: Read about the token's role in its ecosystem
- Sources and Assumptions: Review the basis for the displayed schedule
Perpetual Markets
The Markets tile on token pages now includes a Perp view alongside spot markets. Compare perpetual trading venues by trading volume, open interest, and funding rates, and follow the market links for more detail. Coverage depends on the markets available for each token.
Improvements and Fixes
We've expanded our market-data collection with exchange and DEX candle sources, added checks for missing or unreliable data, and improved price and volume history consistency.
This release also brings smoother chart loading, and fixes for search results, header alignment, theme switching, and session handling.
We're excited for you to explore the new charts and look forward to your feedback!