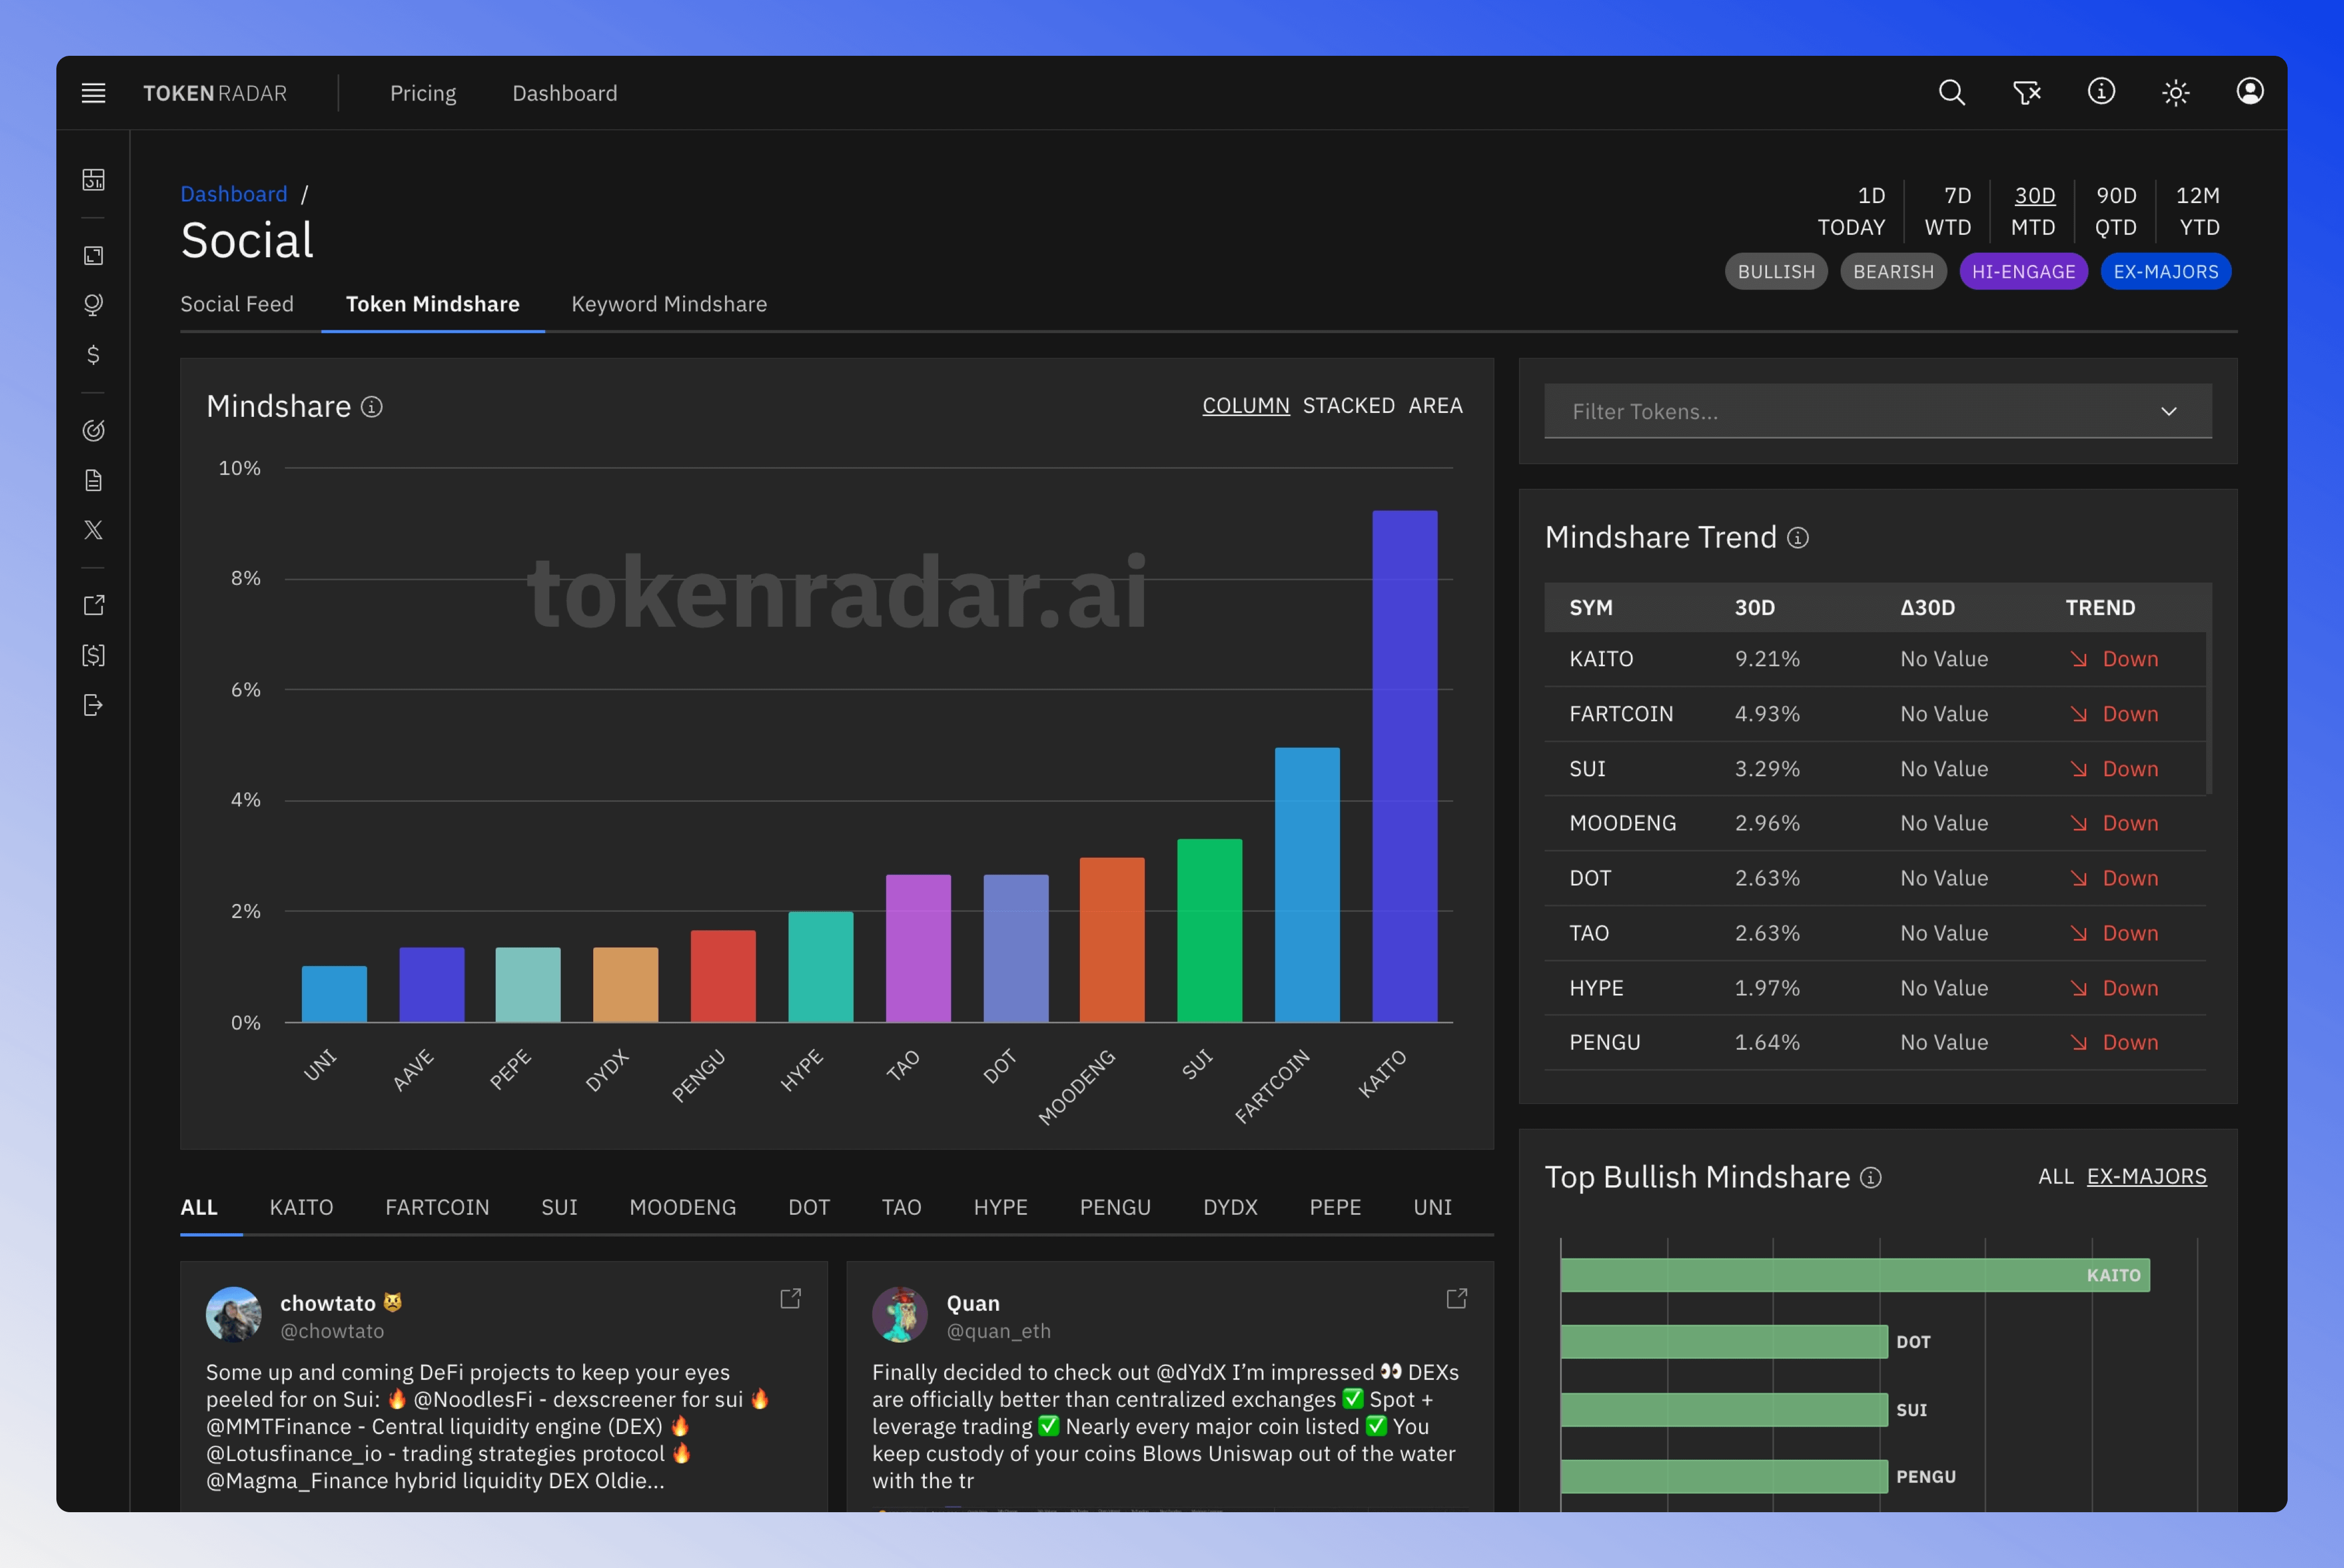
Token Social Mindshare
The Token Mindshare page tracks how often tokens are mentioned across social media platforms. Interactive charts and customizable filters help you identify trending tokens and analyze social sentiment patterns.
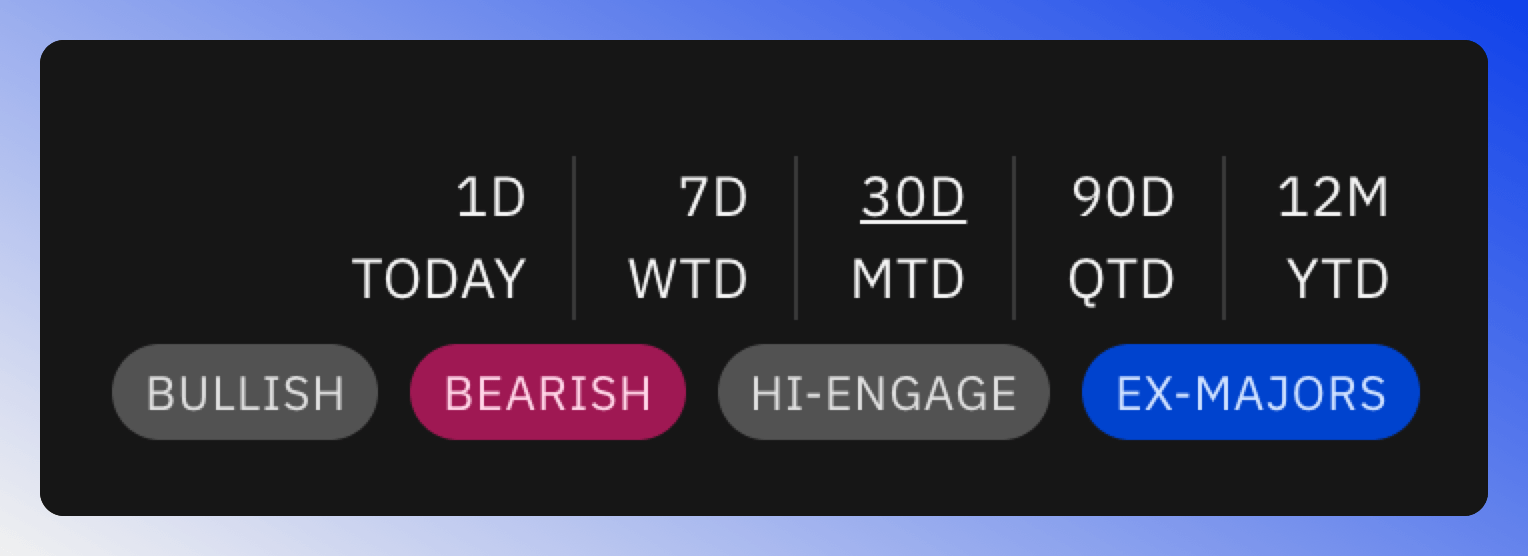
Main Filter
The main time and filter settings on the top right can be used to adjust the time and filter settings of the whole page:
- BULLISH: Shows only bullish/positive social mentions
- BEARISH: Shows only bearish/negative social mentions
- HI-ENGAGE: Filter by posts with high engagement
- EX-MAJORS: Excludes mentions of major cryptocurrencies (BTC, ETH, etc.)
Mindshare Chart
The Mindshare Chart visualizes how frequently different tokens are mentioned on social media platforms. The chart uses distinct colors for each token, making it easy to track and compare the social media attention that different cryptocurrencies receive. You can view this data in three different formats: Column Chart, Stacked Chart, or Area Chart.
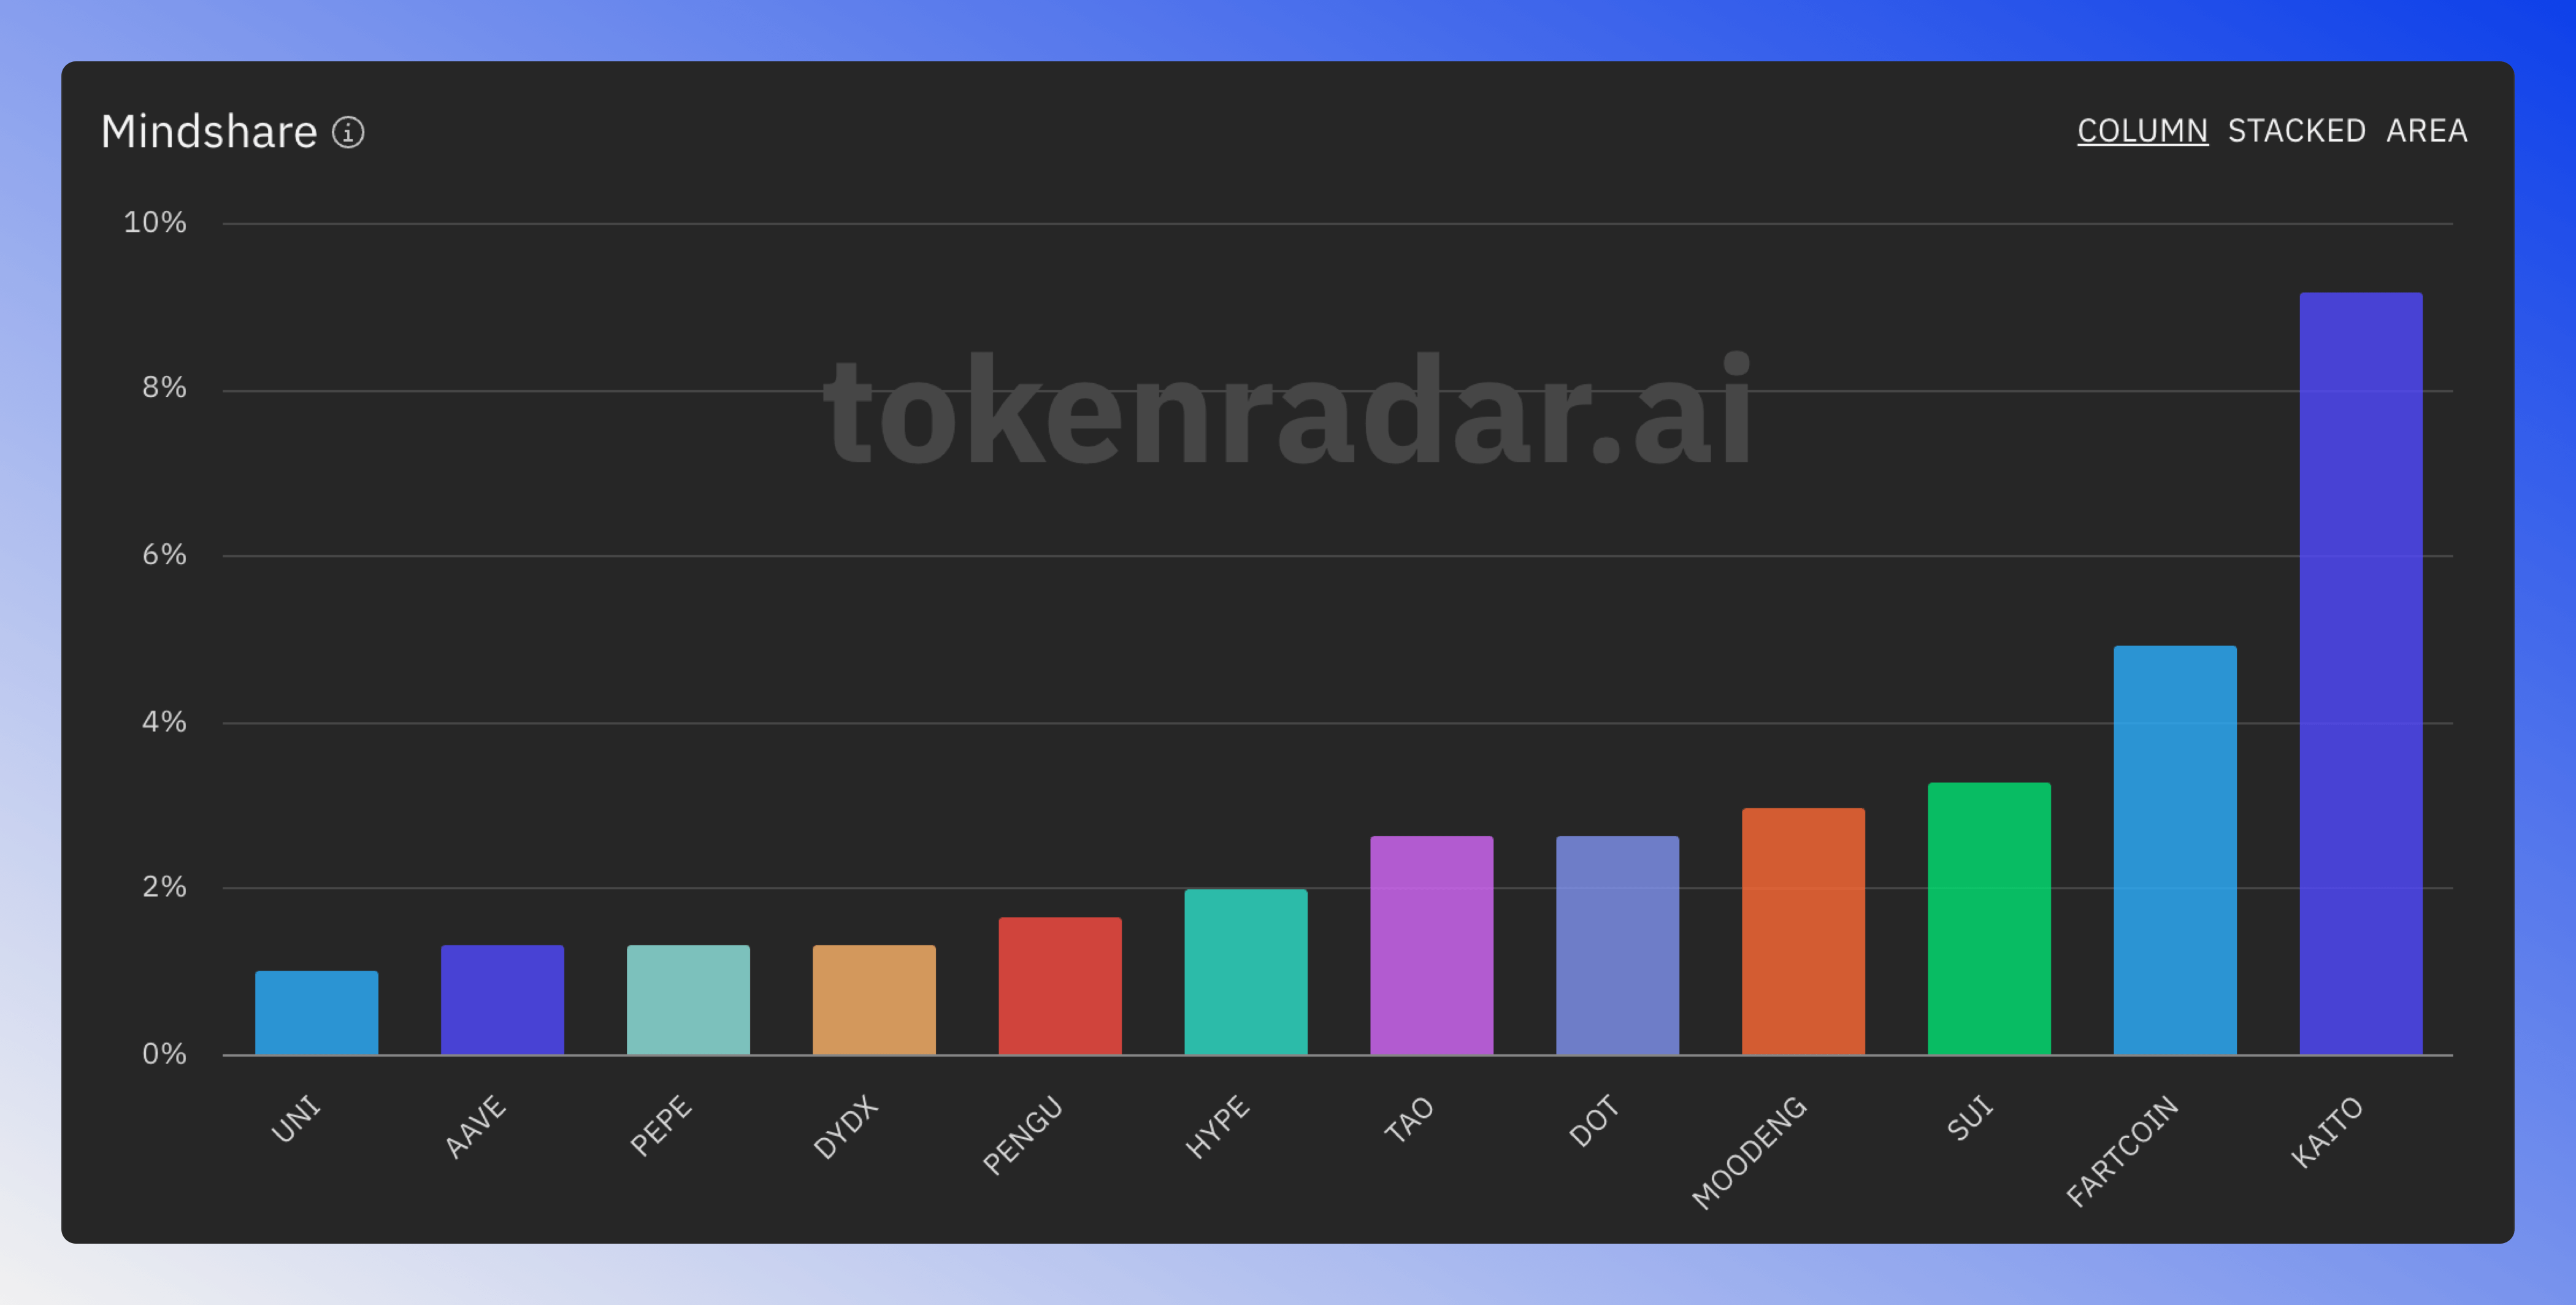
Column Chart
The Column Chart View shows tokens as individual bars for easy comparison. Use "EX-MAJORS" filter to discover trending non-major tokens.
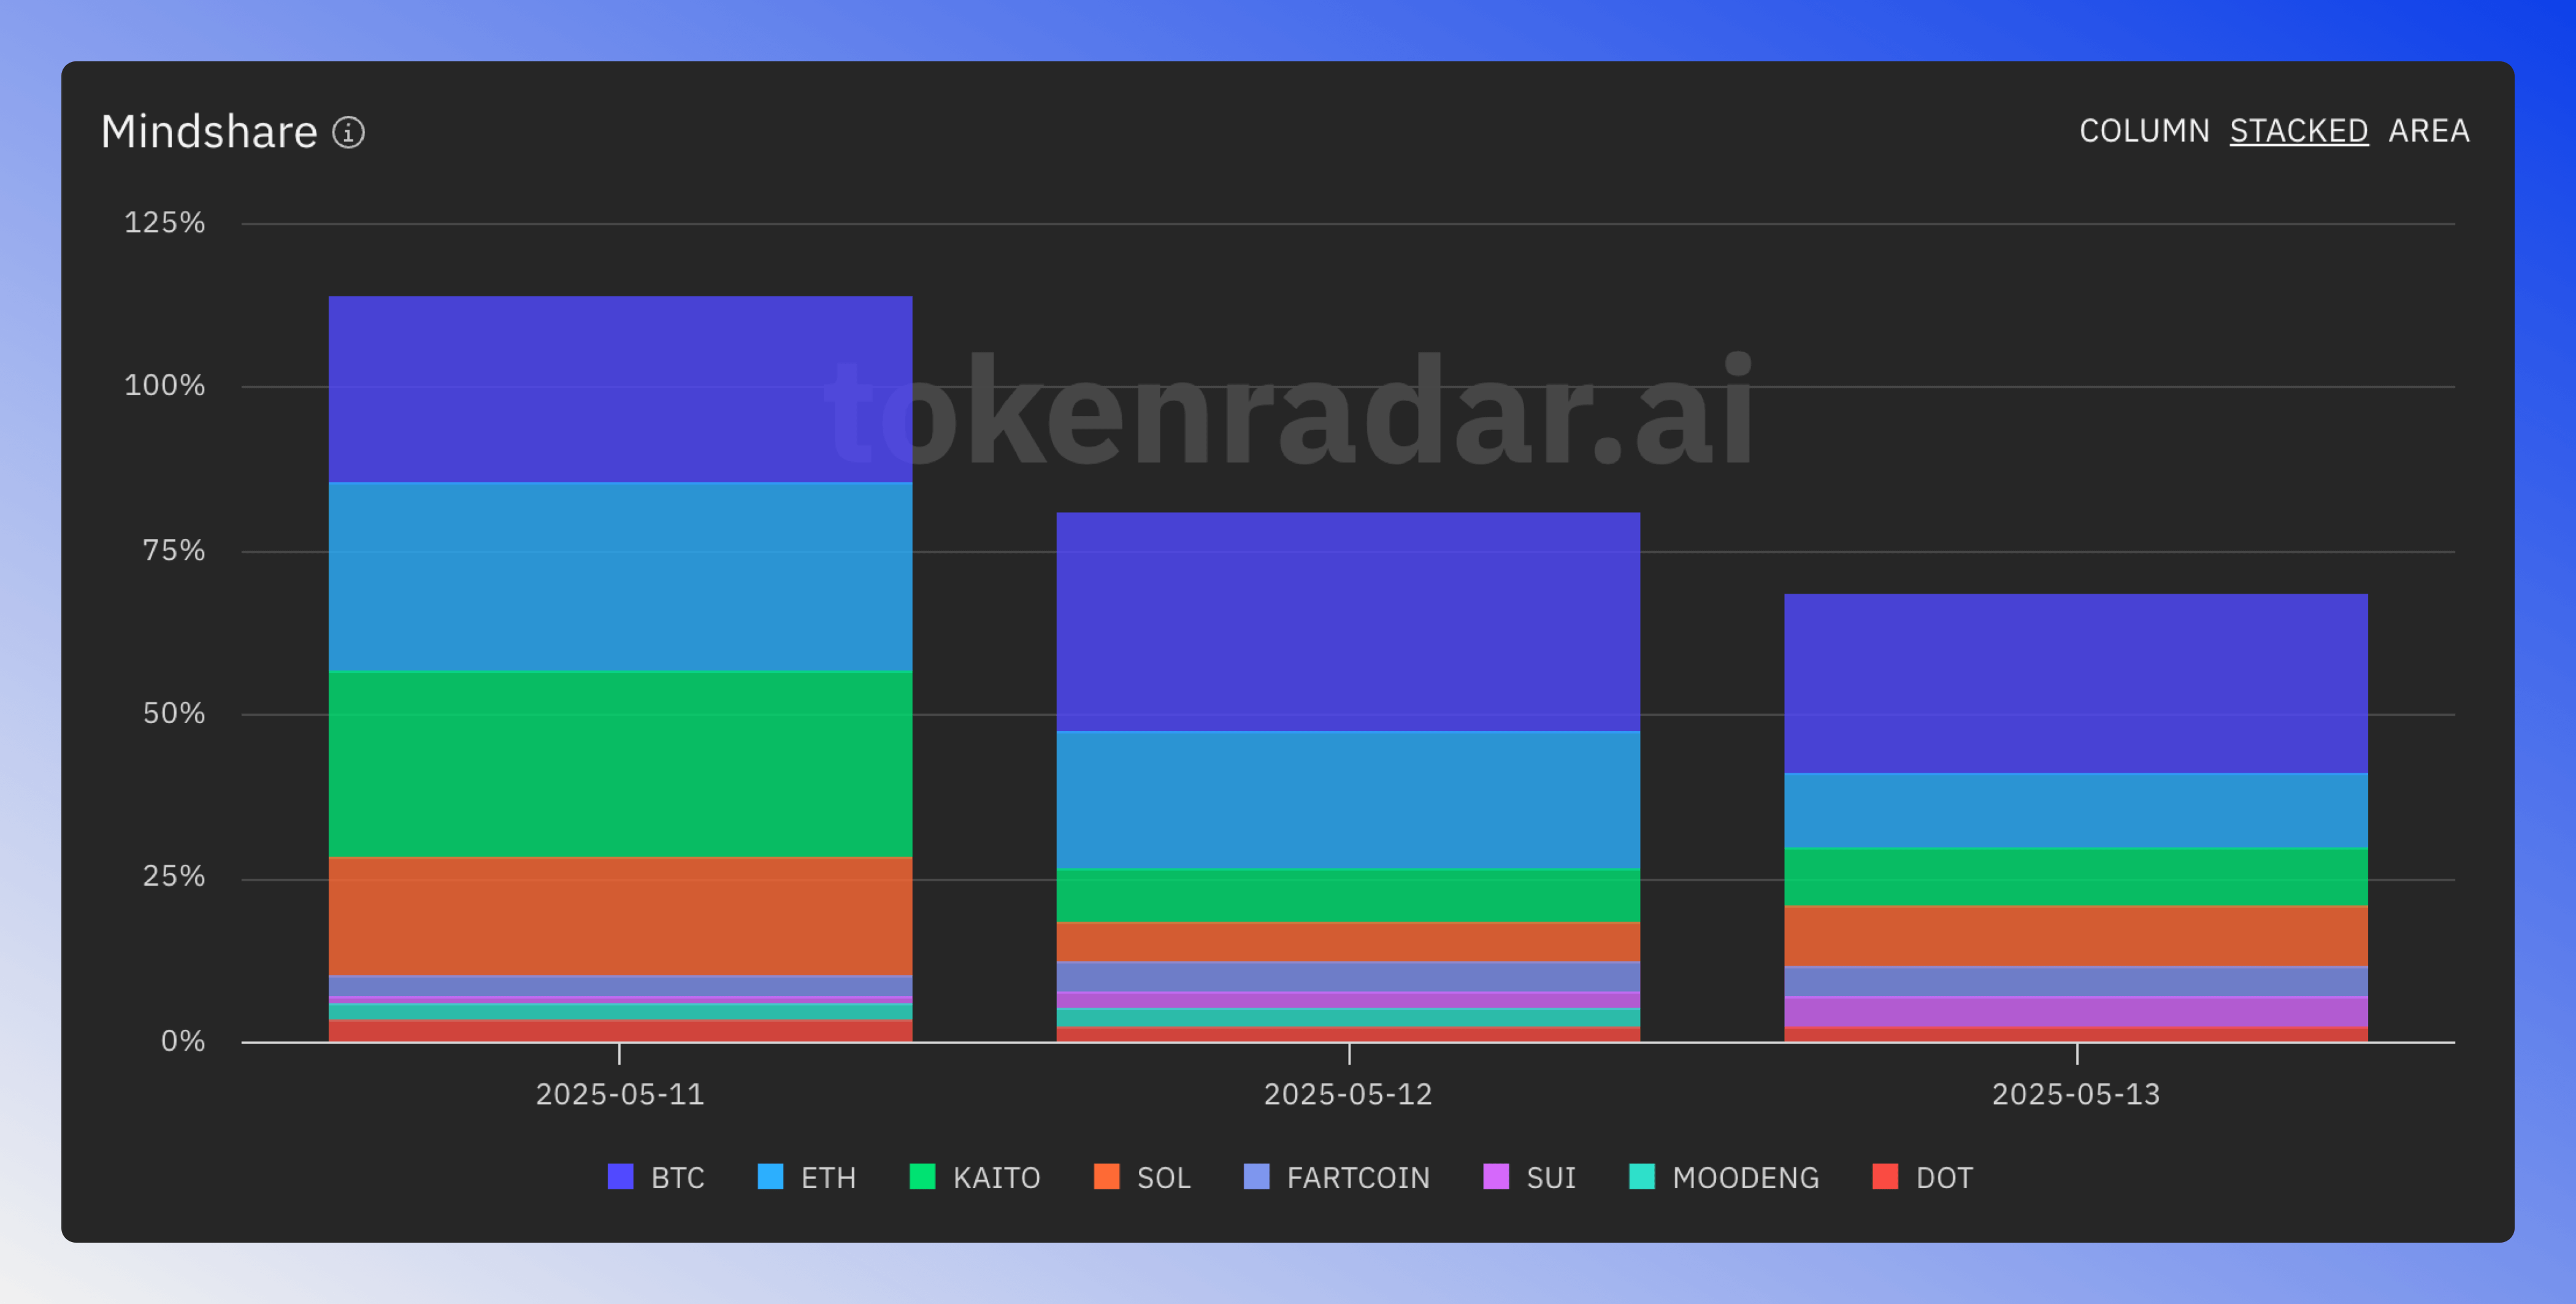
Stacked Chart
The Stacked Chart View shows all tokens combined in one bar, revealing overall mention patterns across time periods.
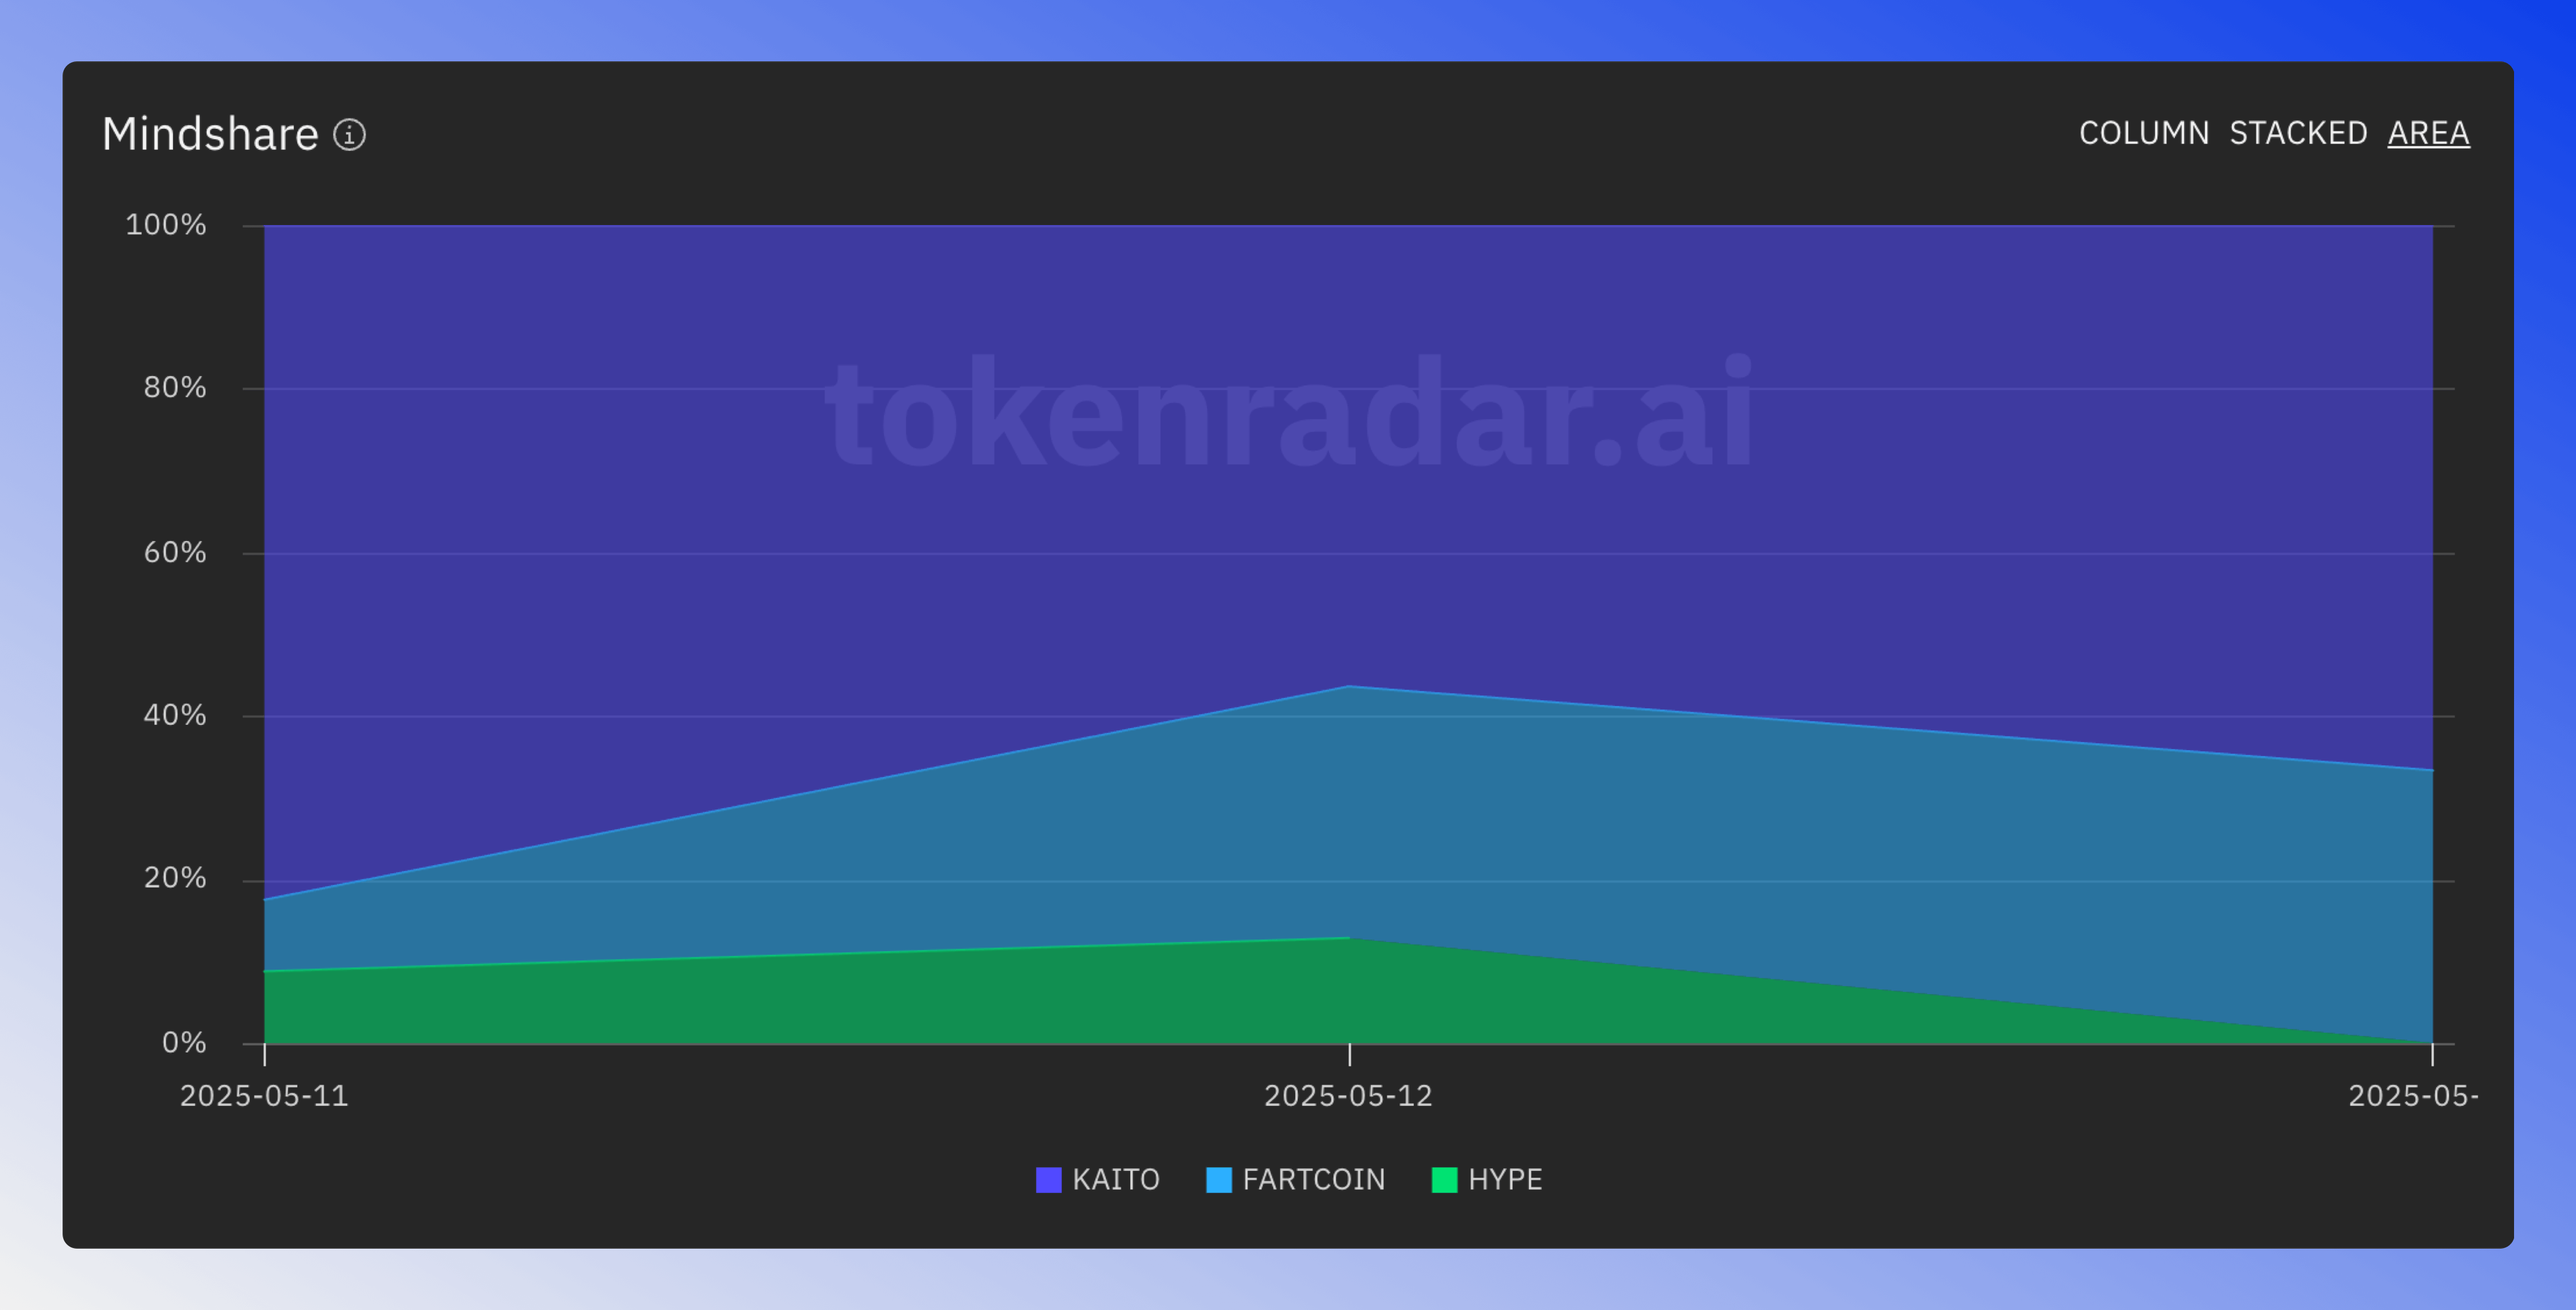
Area Chart
The Area Chart lets you compare the mention frequency of multiple tokens over time.
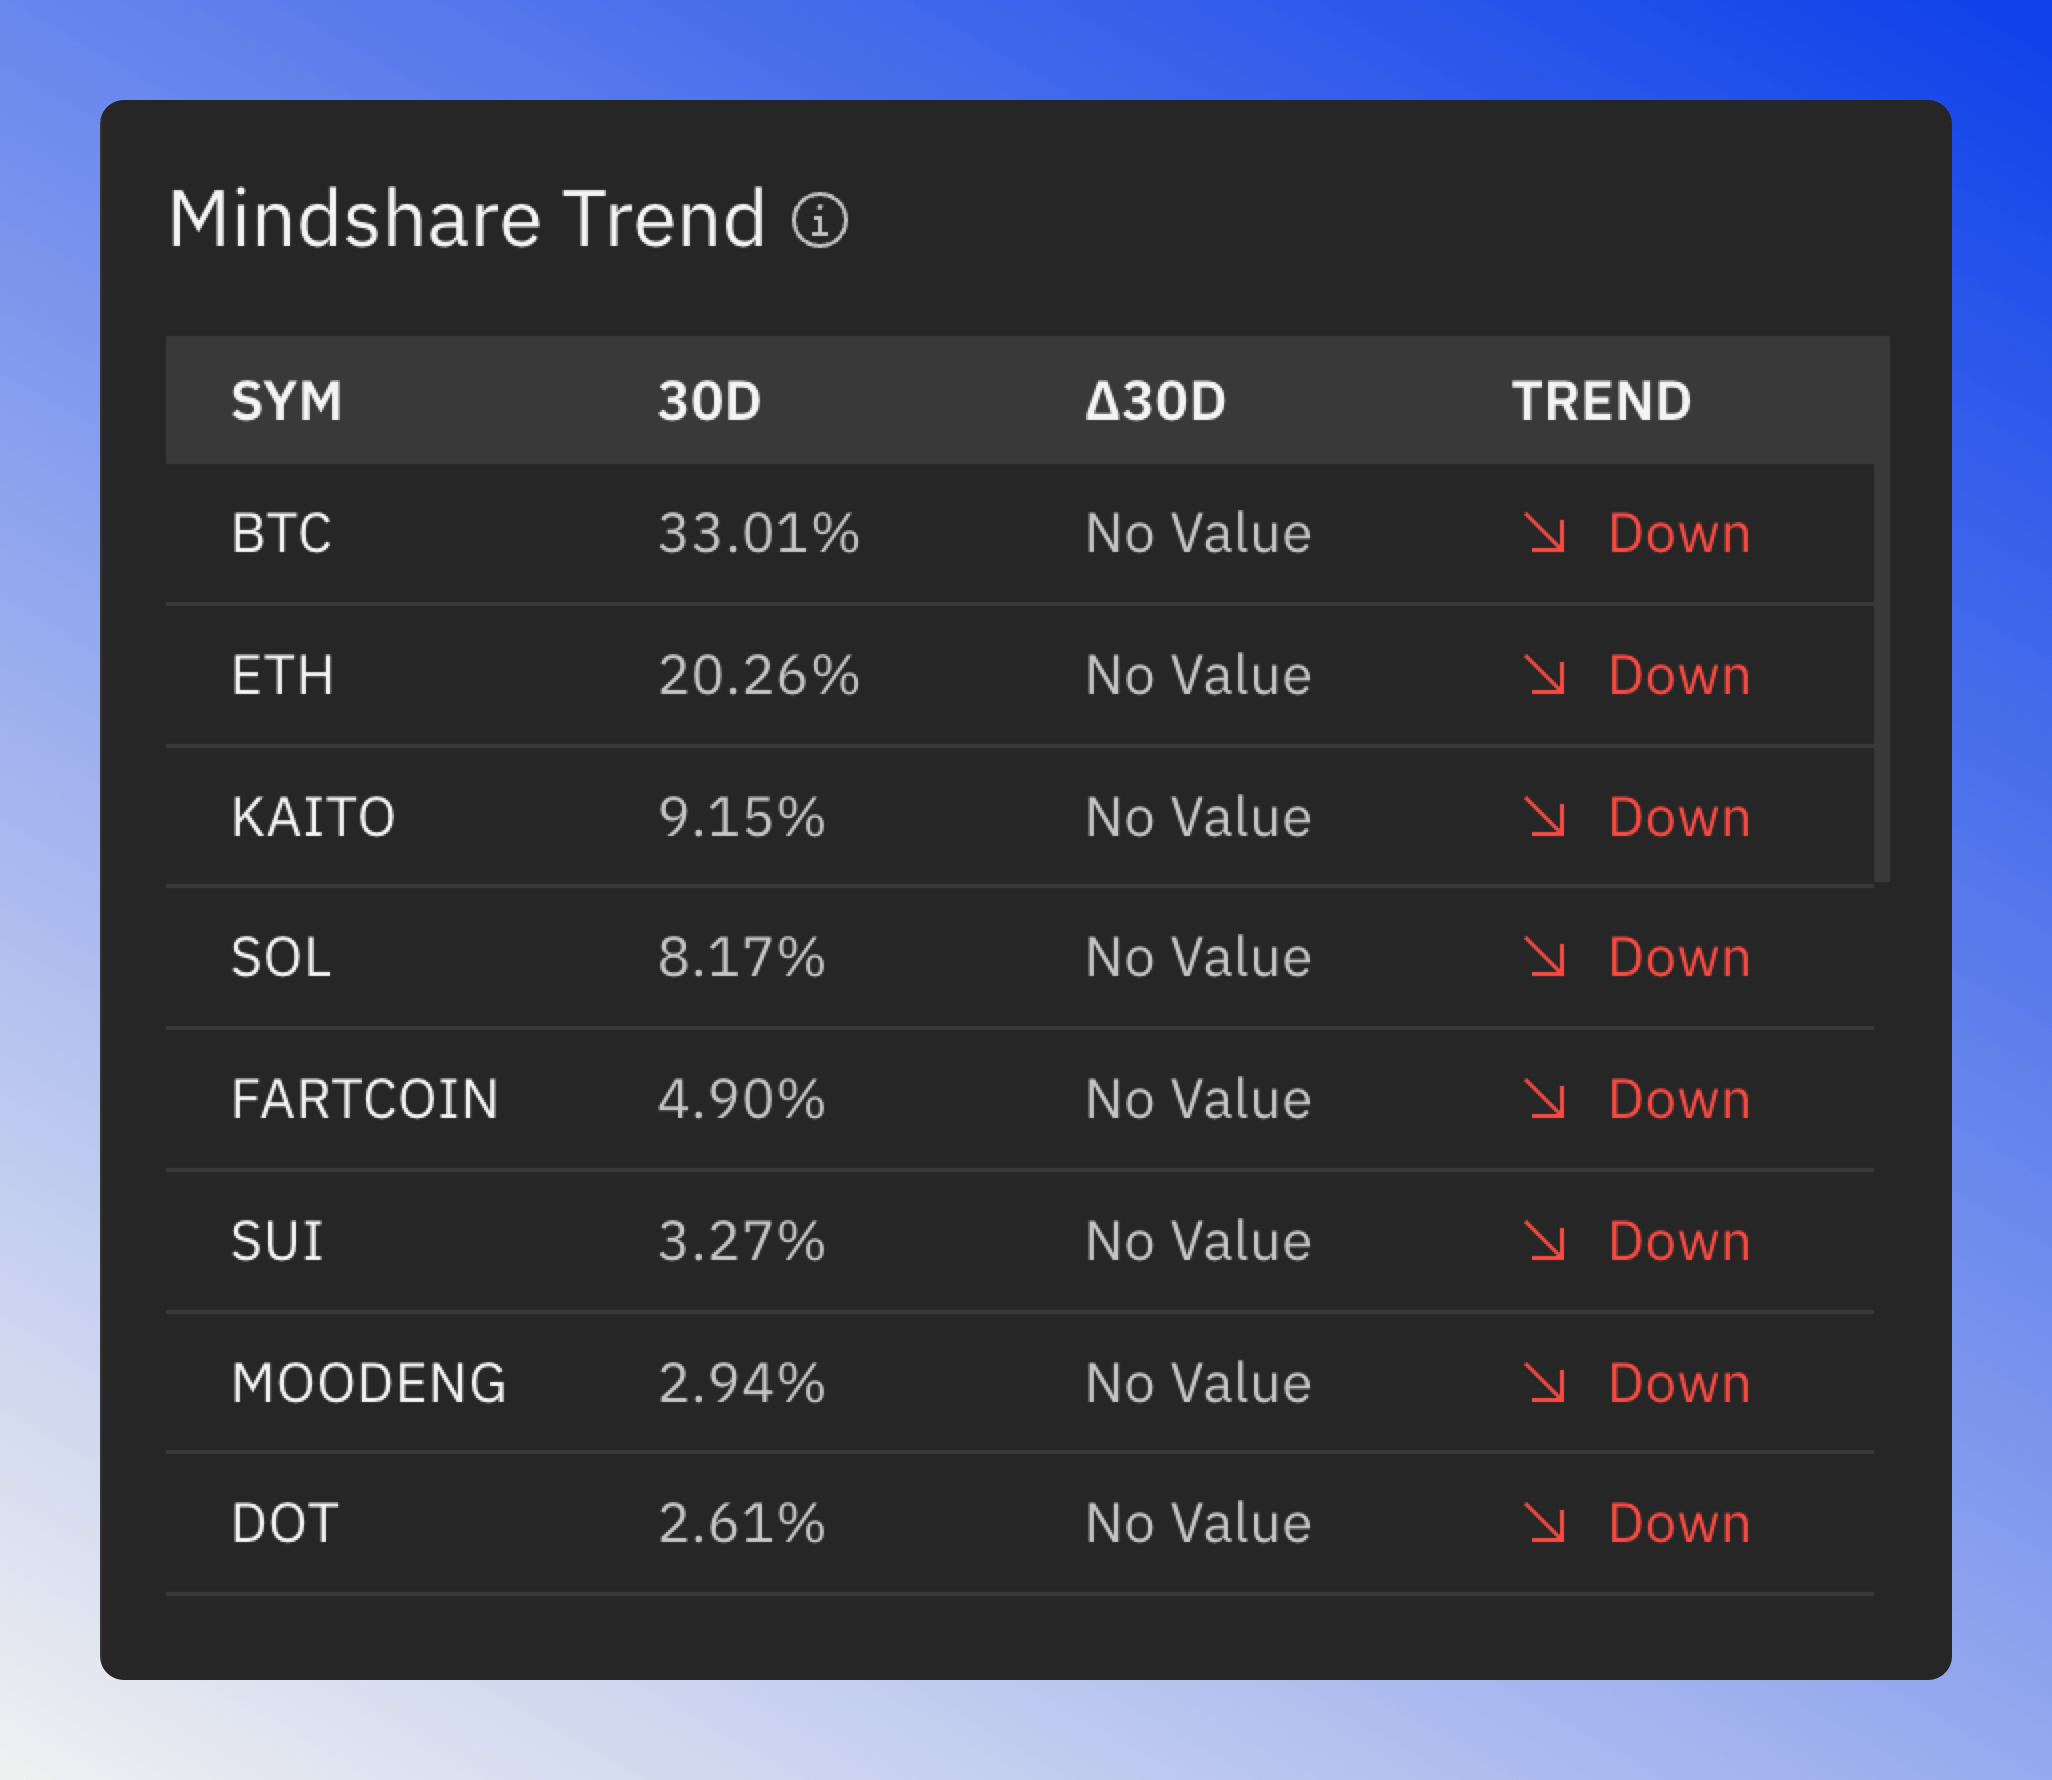
Mindshare Statistics Table
The statistics table shows all the mindshare data for the selected timespan in tabular format, the percentage change compared to the previous period, and the trend direction.
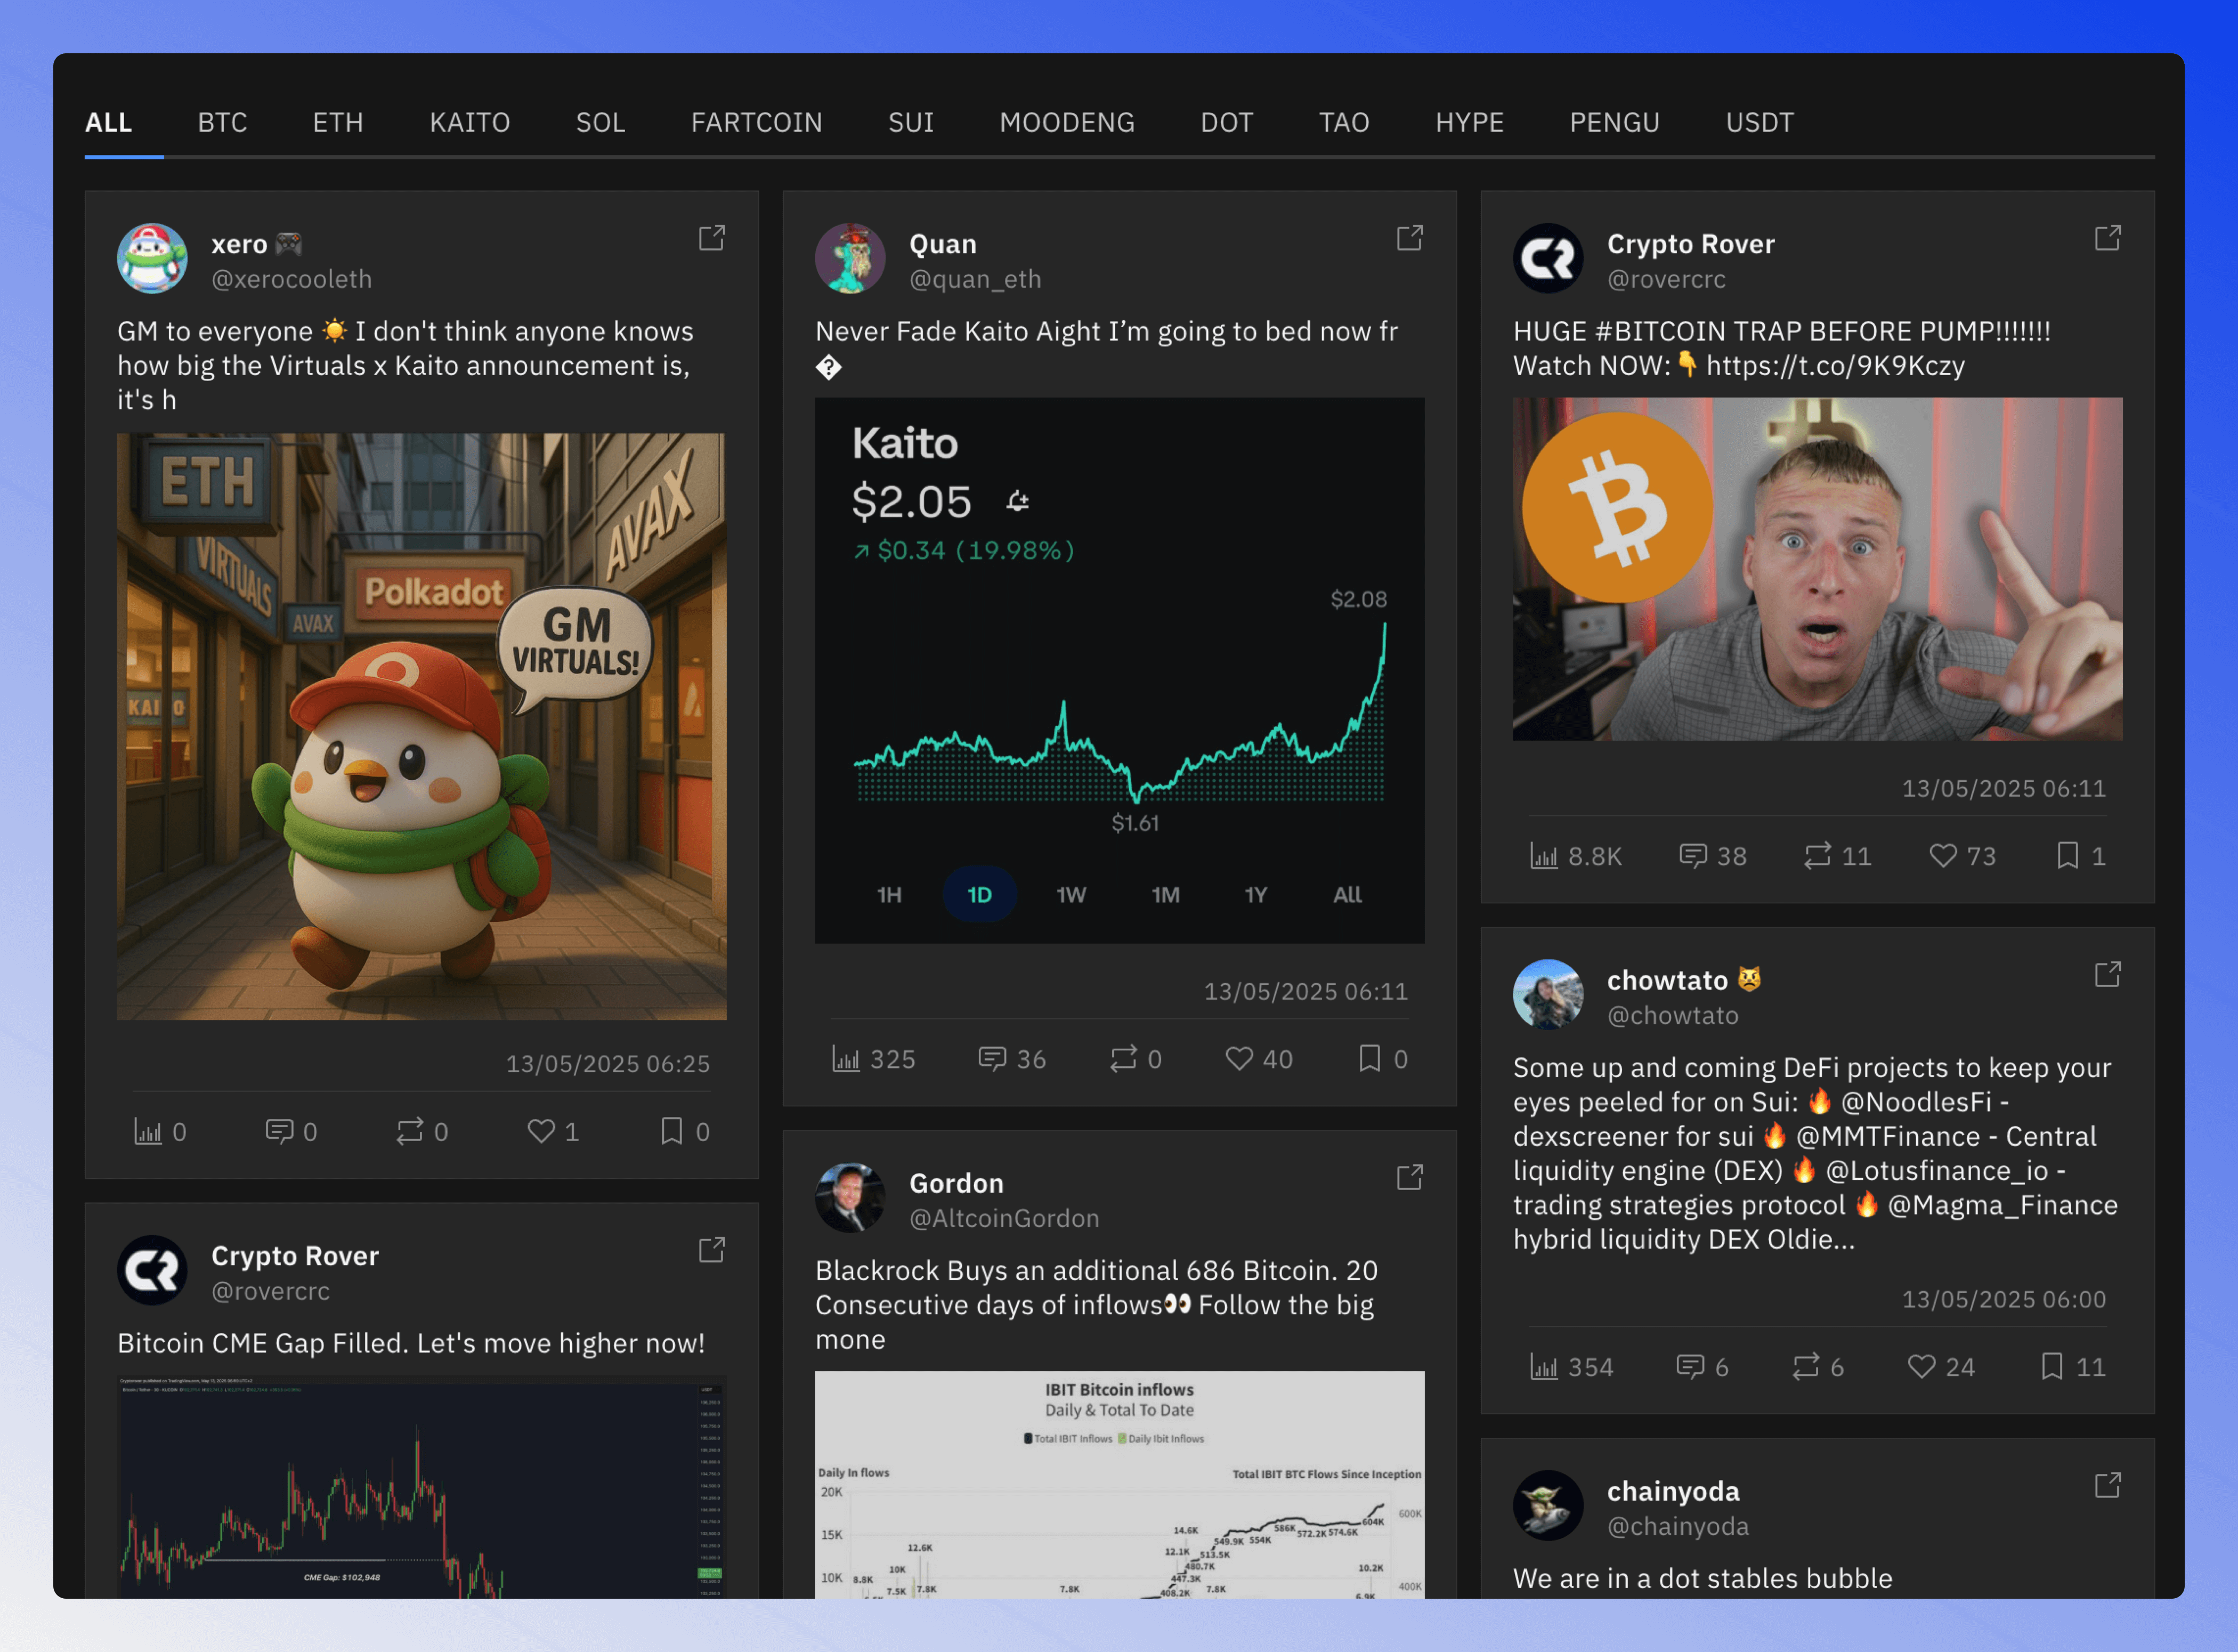
Social Posts Grid
The Social Posts grid shows posts for the most mentioned tokens. Each token has its own tab, posts are sorted by recency.
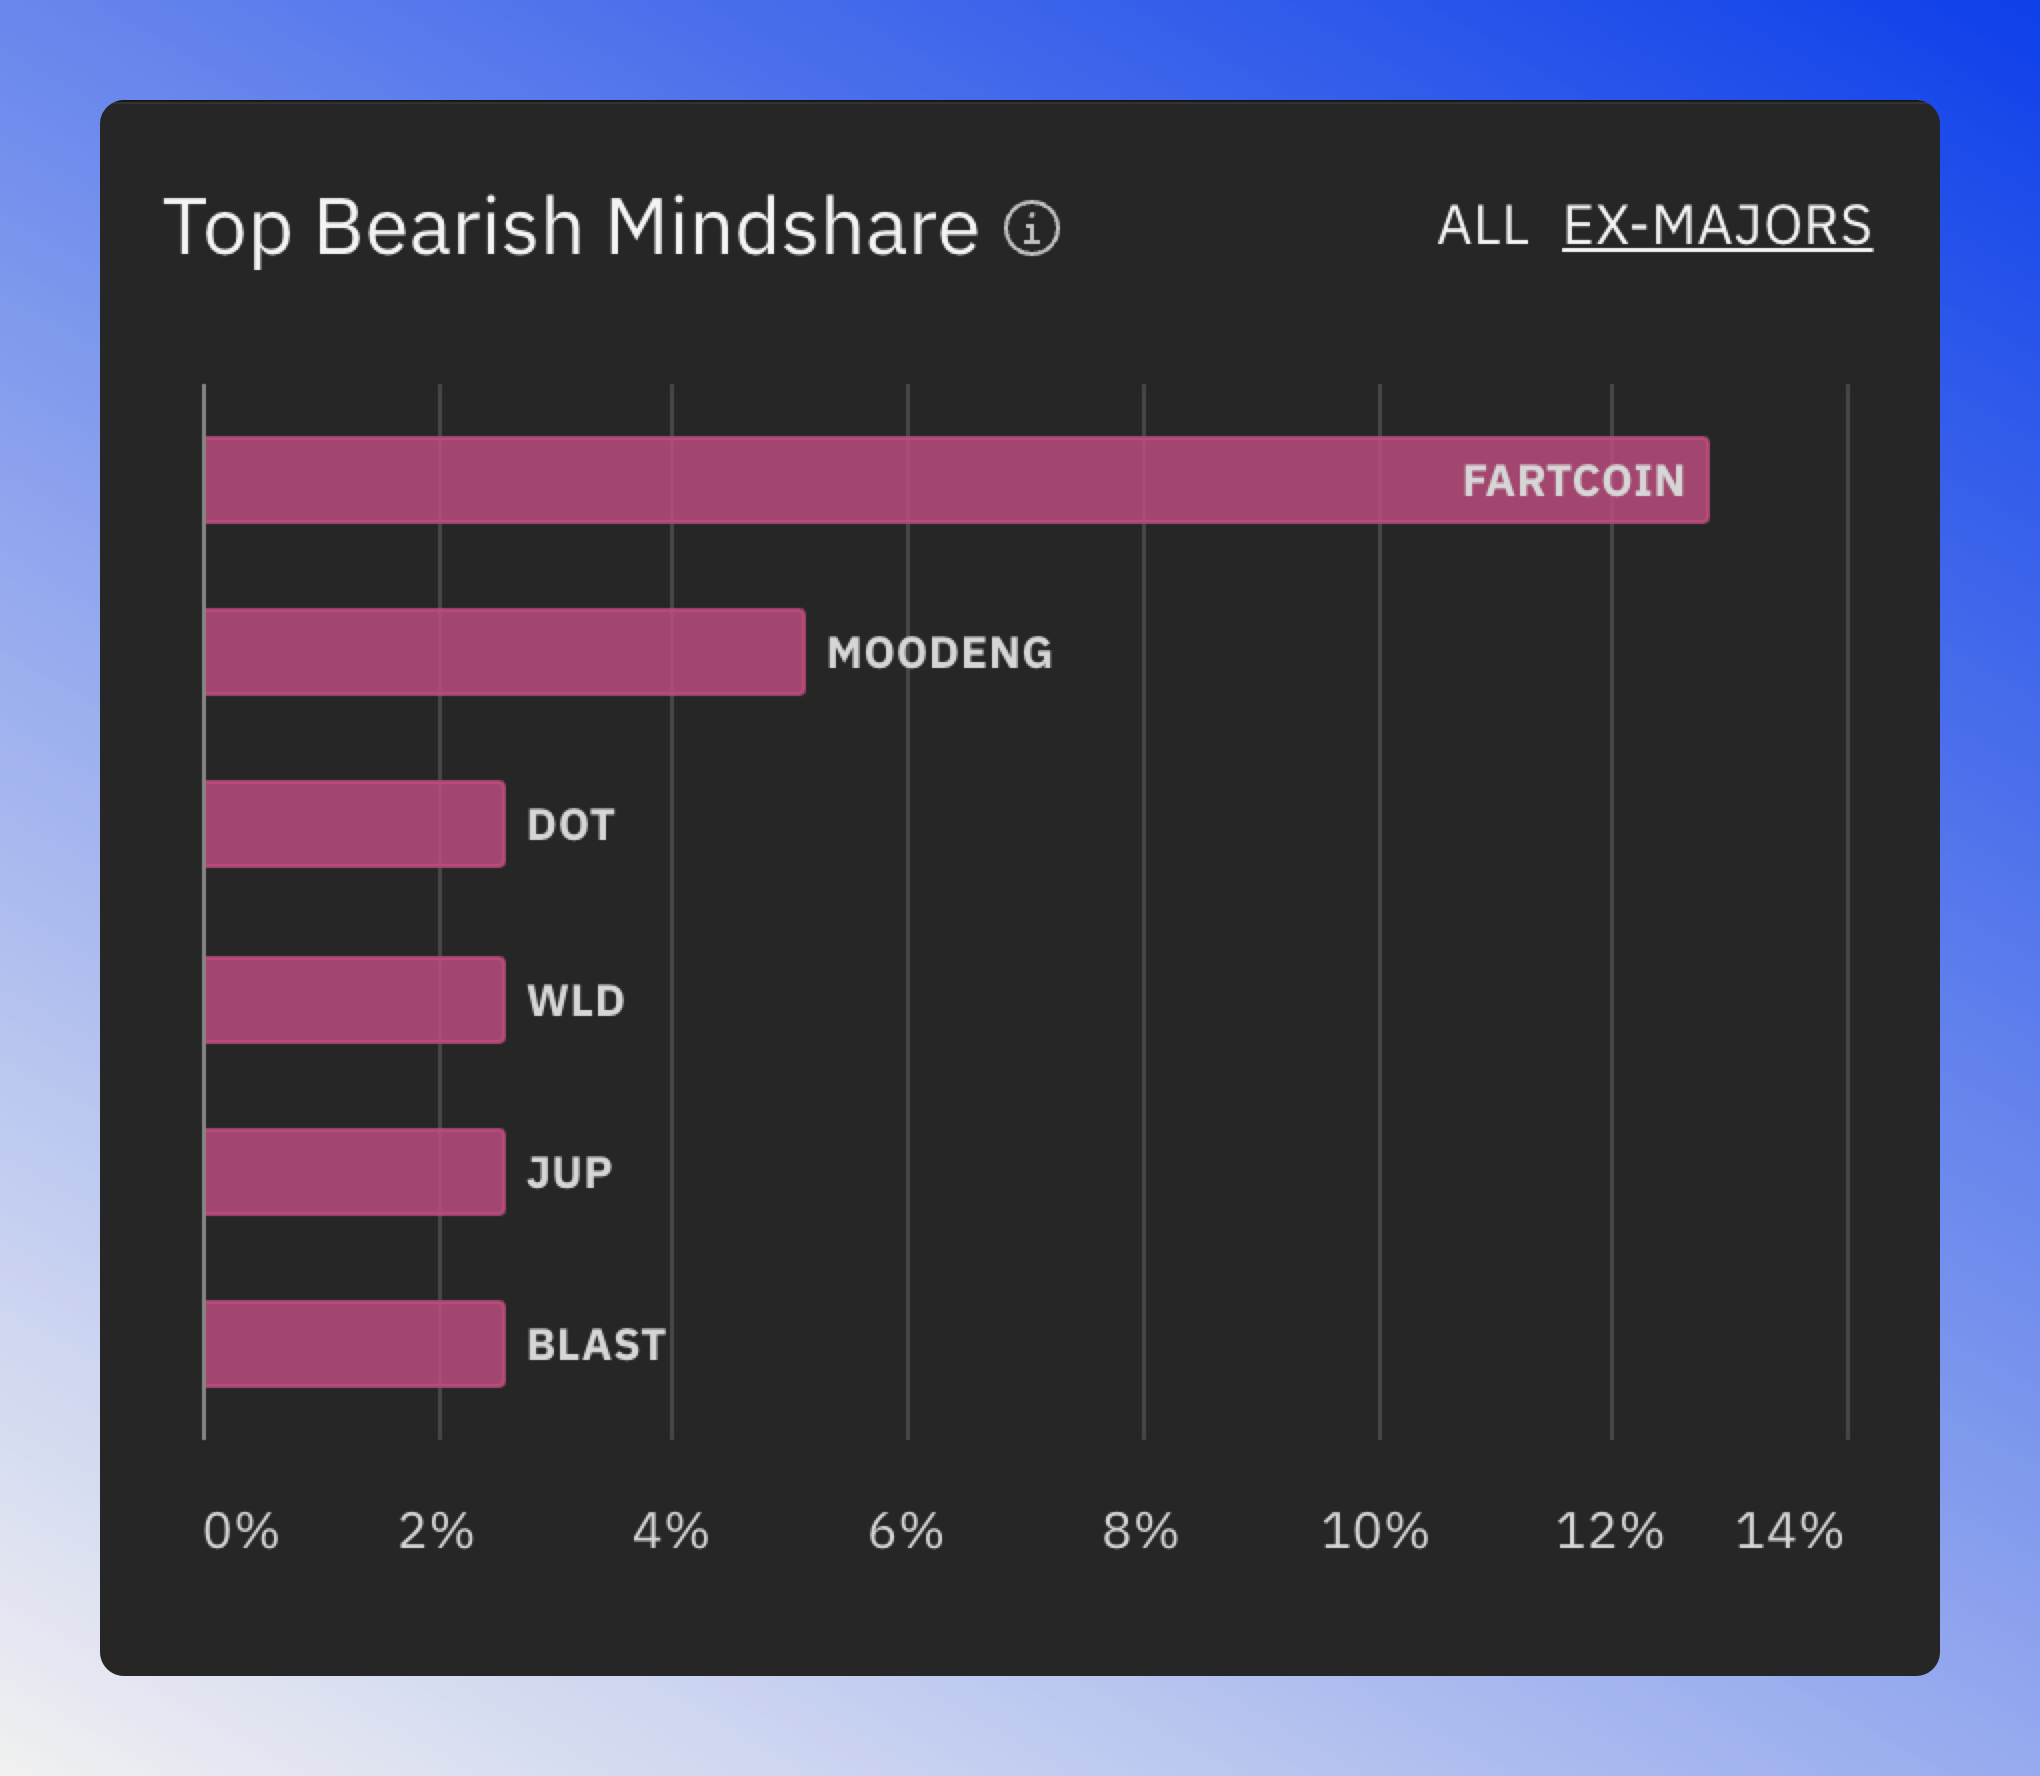
Sentiment Analysis Charts
This charts shows which tokens have the most positive and negative sentiment across social media, helping you understand market perception.